
Infographics
Public and private partners working to improve educational outcomes for students in foster care are welcome to use infographics from our gallery in presentations, reports, websites, or other not-for-profit communication tools.
Please download our factsheets and share with your stakeholders:
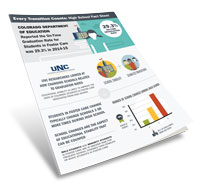
Every Transition Counts: High School

Every Transition Counts: K-12
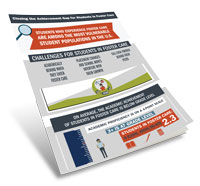
Closing the Achievement Gap for Students in Foster Care
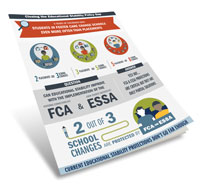
Closing the Educational Stability Policy Gap
Gallery
The statistics represented in infographics are findings from the Colorado Study of Students in Foster Care. The data sources are Colorado Department of Education and Colorado Department of Human Services. Infographic tags will direct you to the reports associated with each analysis.
Please contact us with questions about use of this information and sign up for project updates to ensure you have up to date information on these topics. Review our reports for additional information on these topics.
Download All Infographics
All Files
This zip file includes all infographics in .SVG, .PNG, and .JPG formats.
Please use the appropriate file formats.
.SVG Files
Use these files in print materials. They use the CMYK color formula, and unlike PNG or JPG files, can scale to any size while maintaining clarity.
.PNG Files
PNG files have a transparent background and are ideal for web and other on-screen use. Color formula is RGB.
.JPG Files
White background JPG files are not transparent and use the RGB color formula. These best for web or on-screen use, not print.
Download Individual Infographics


Report: Every Transition Counts (2016)
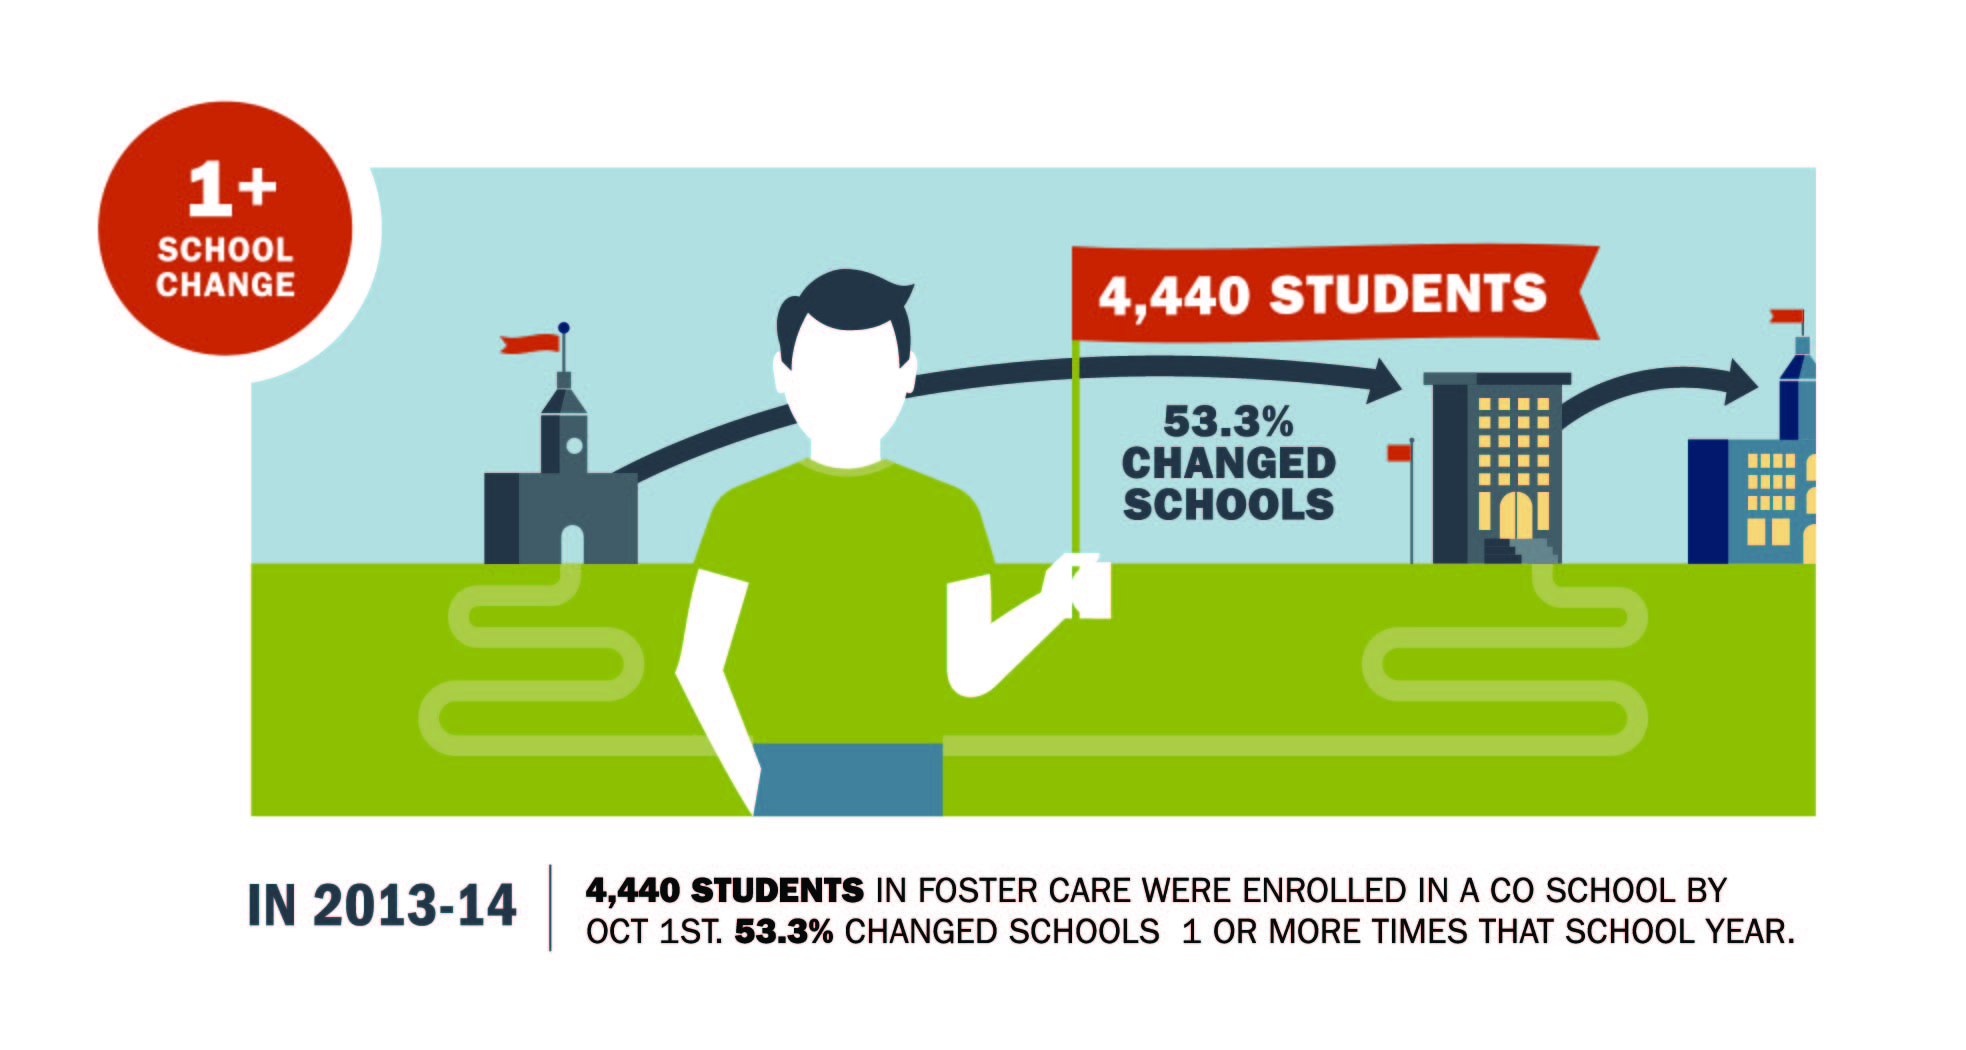
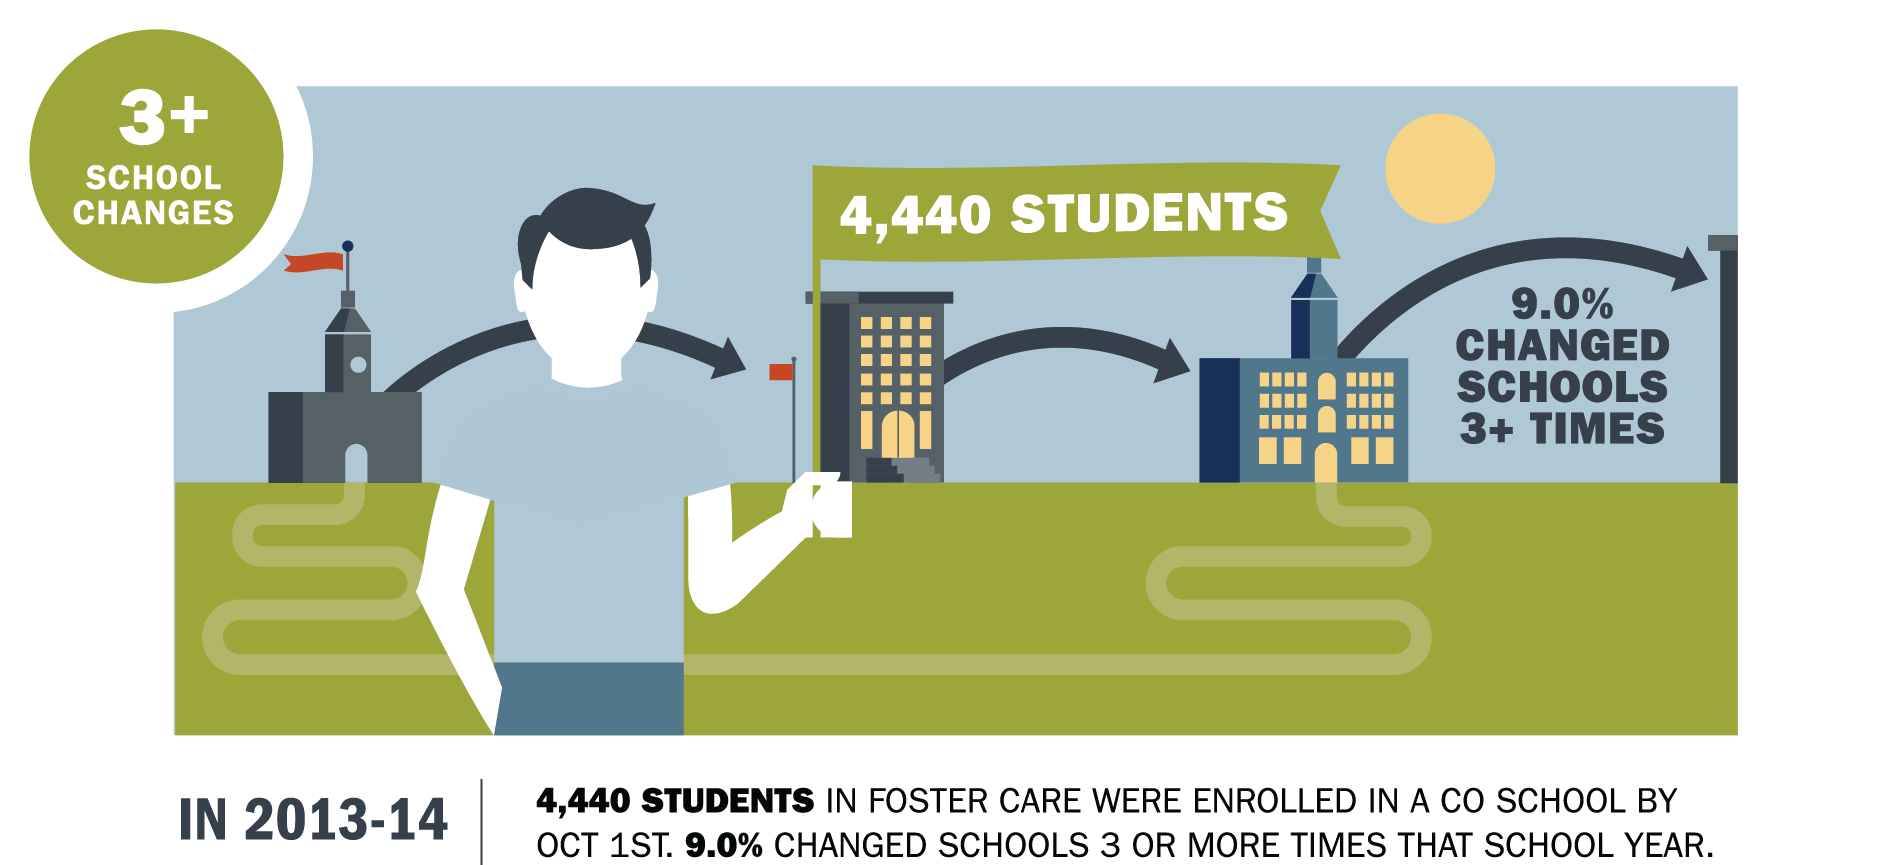
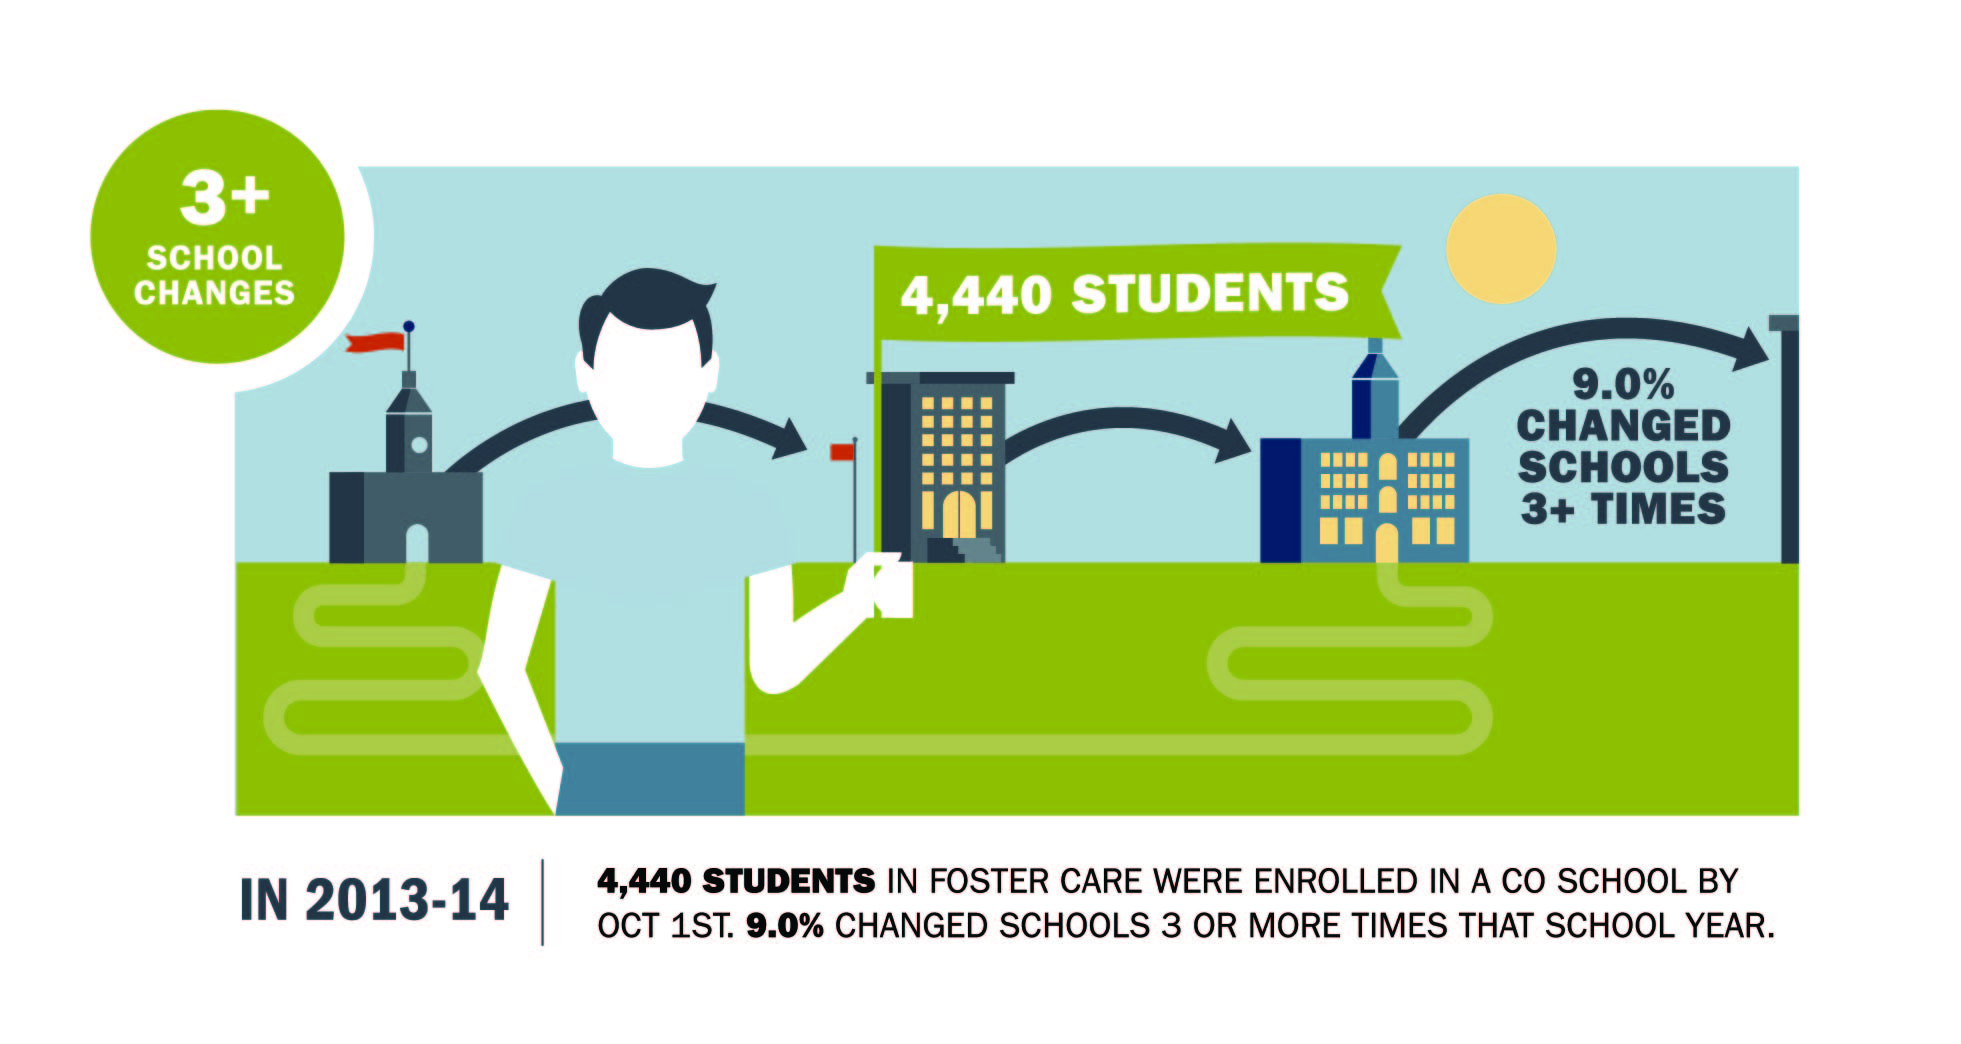
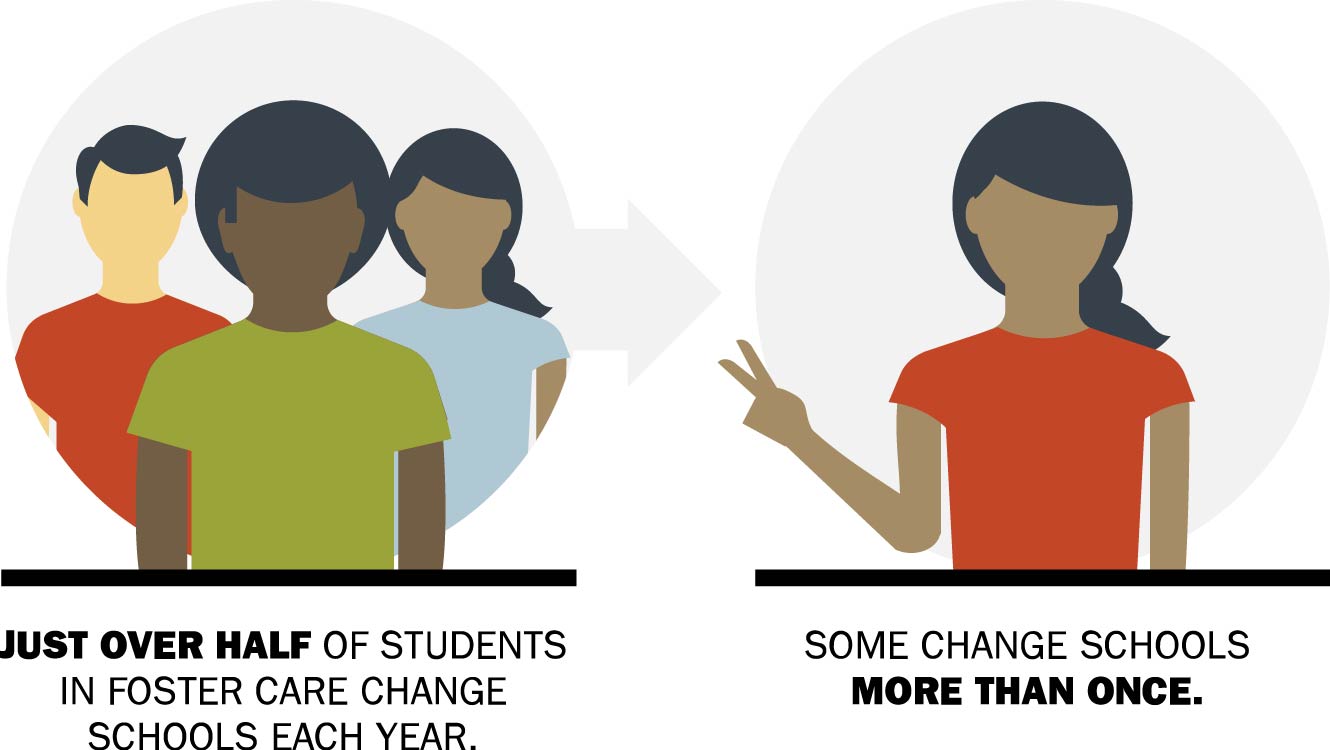
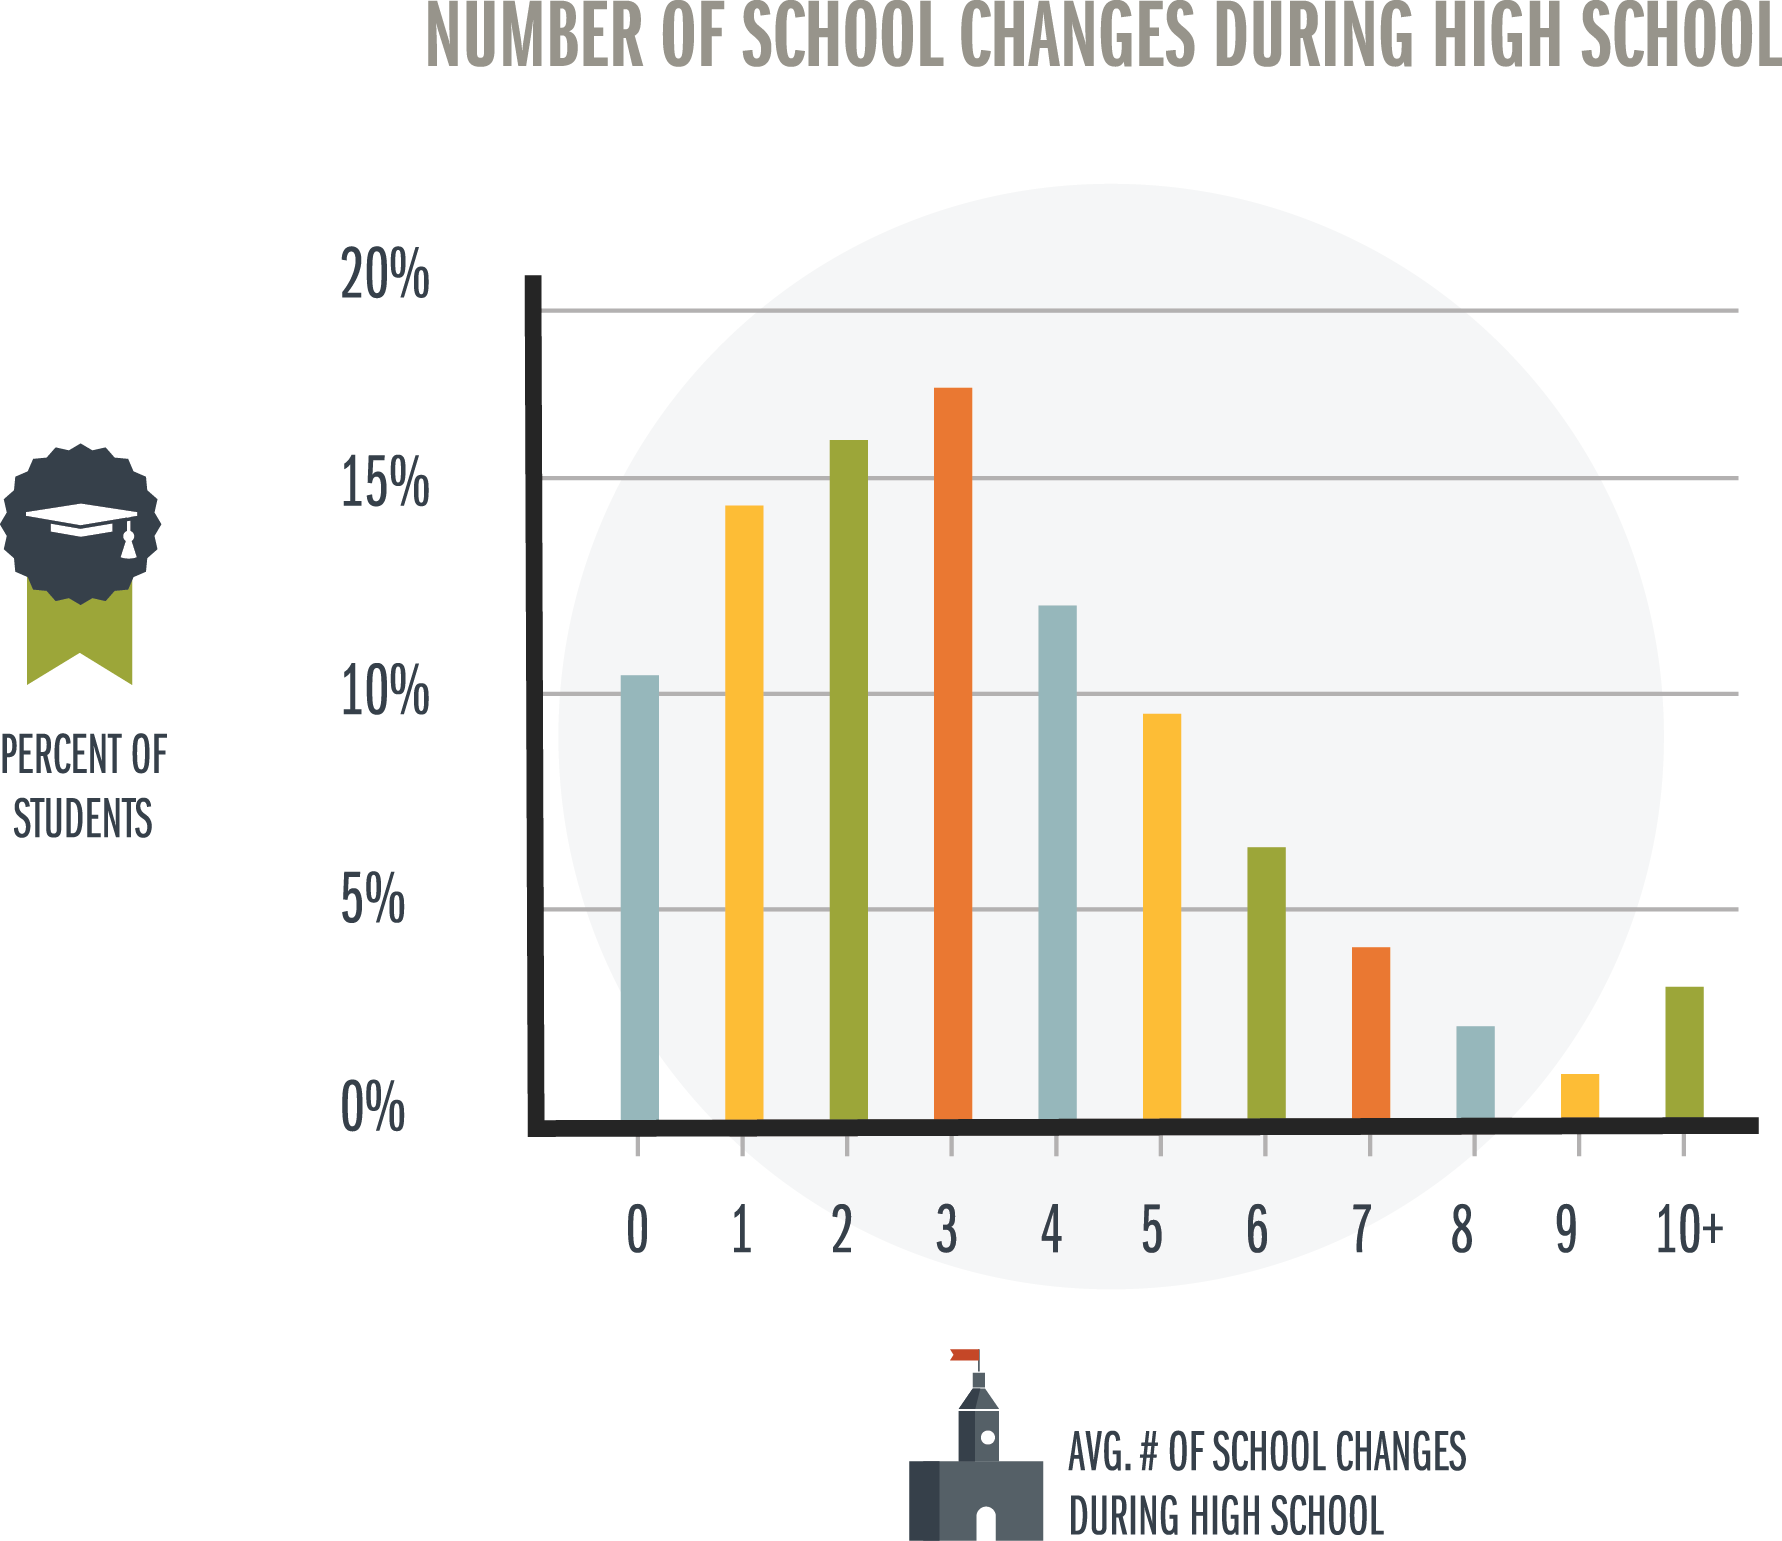
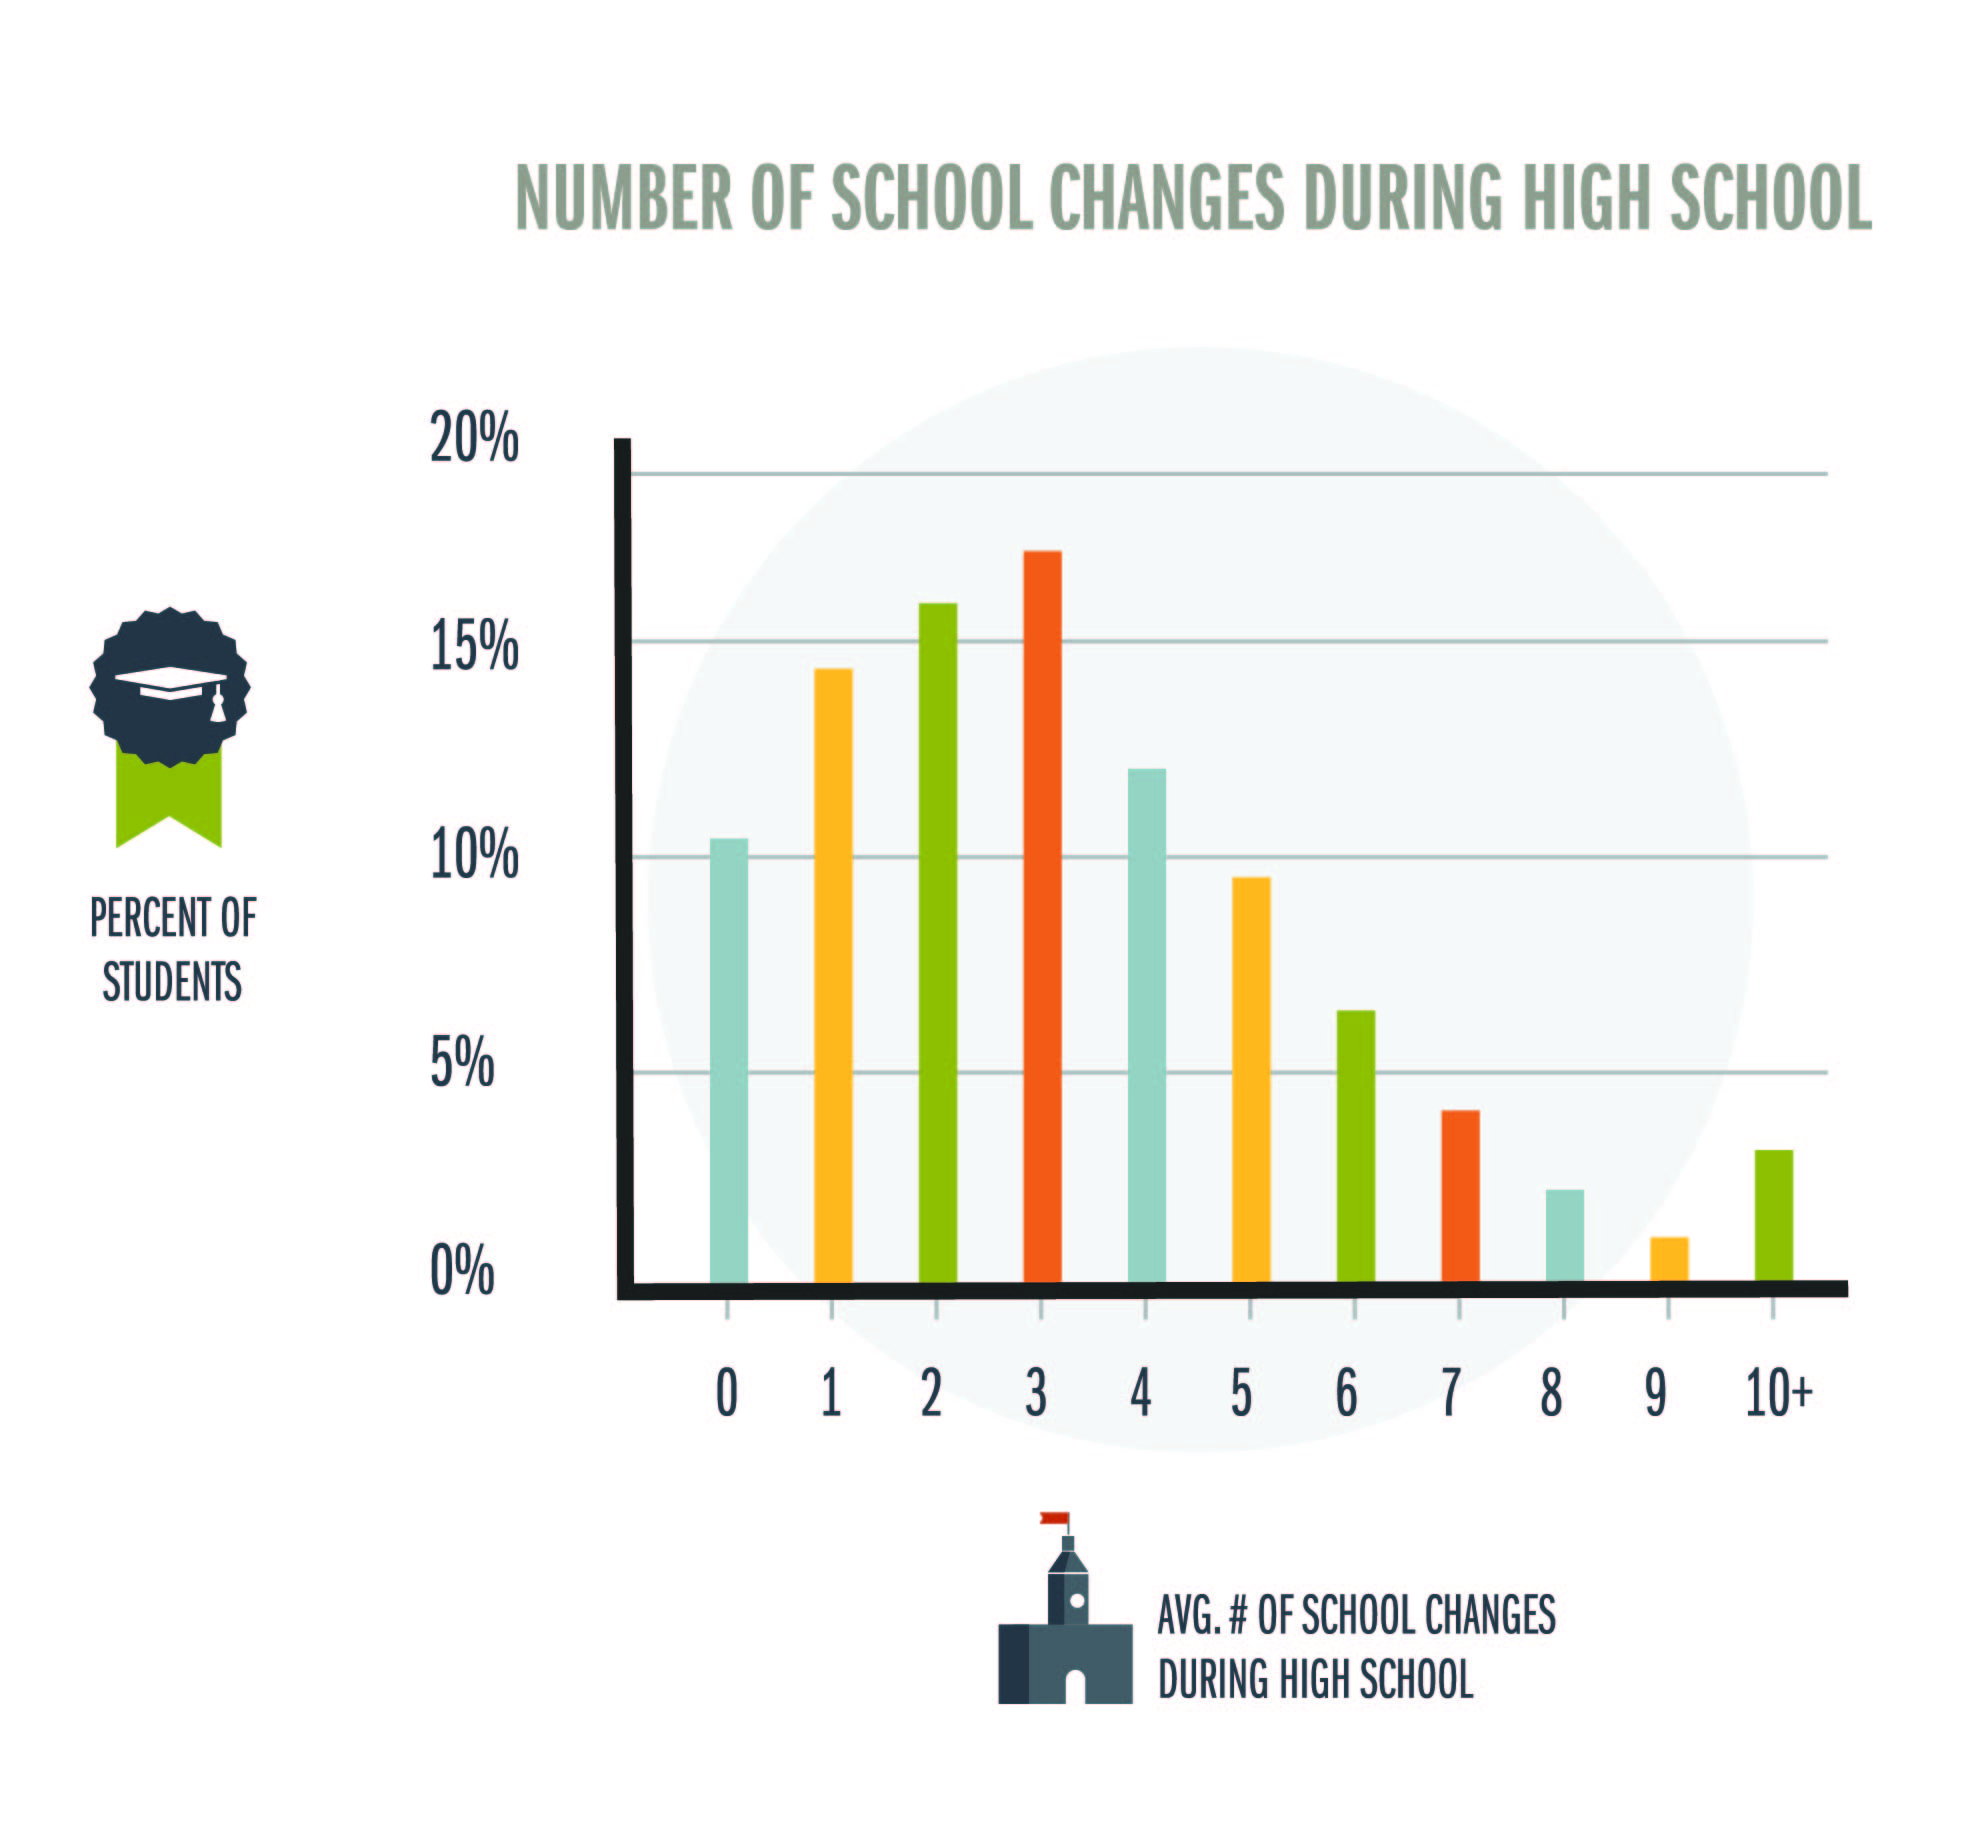
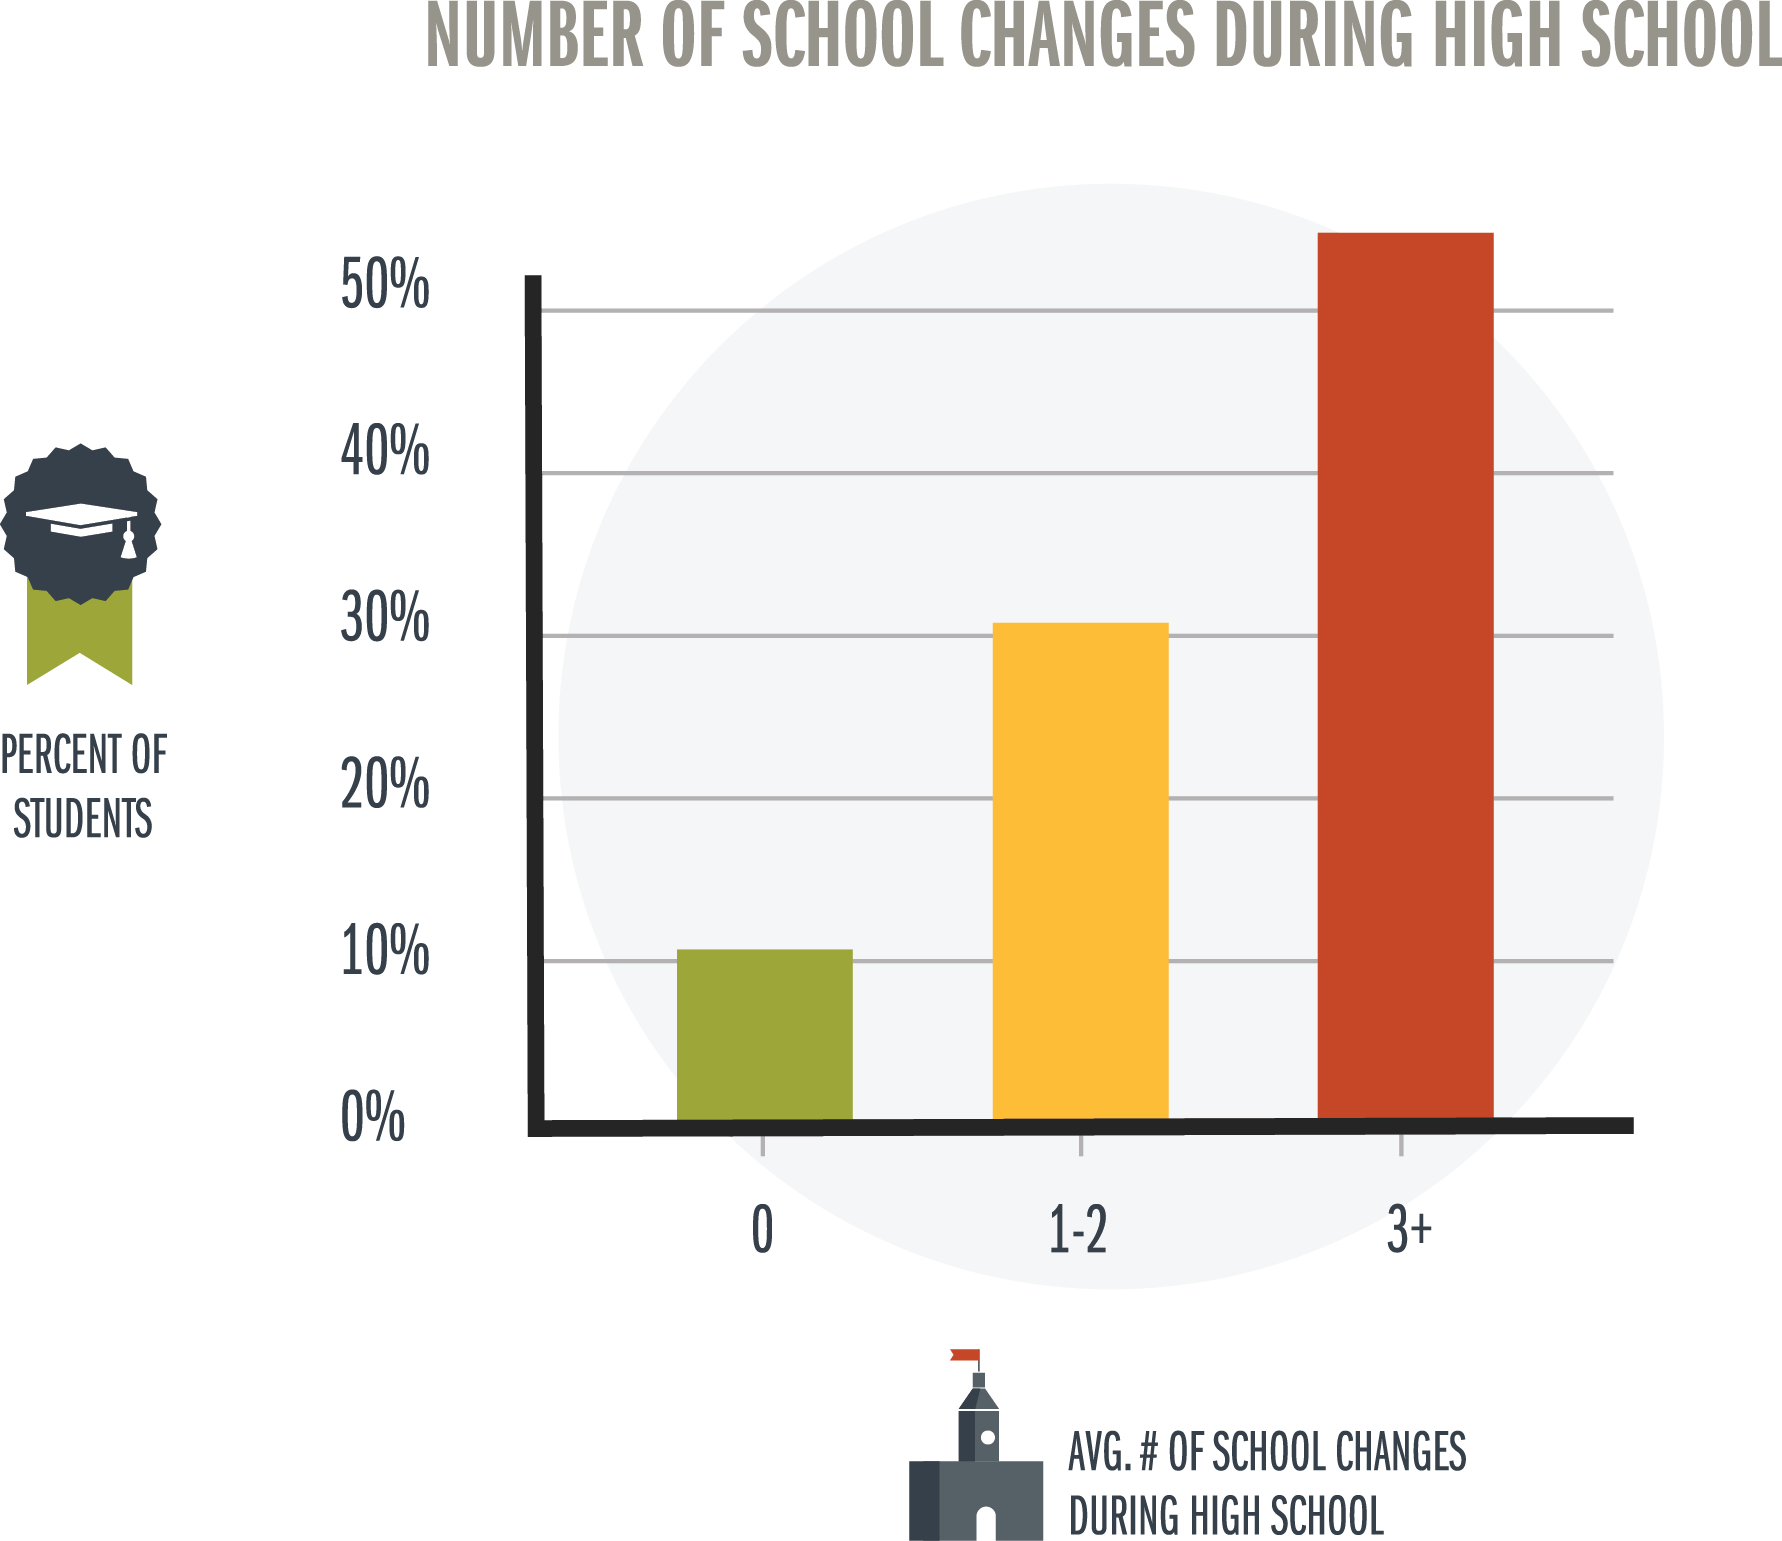
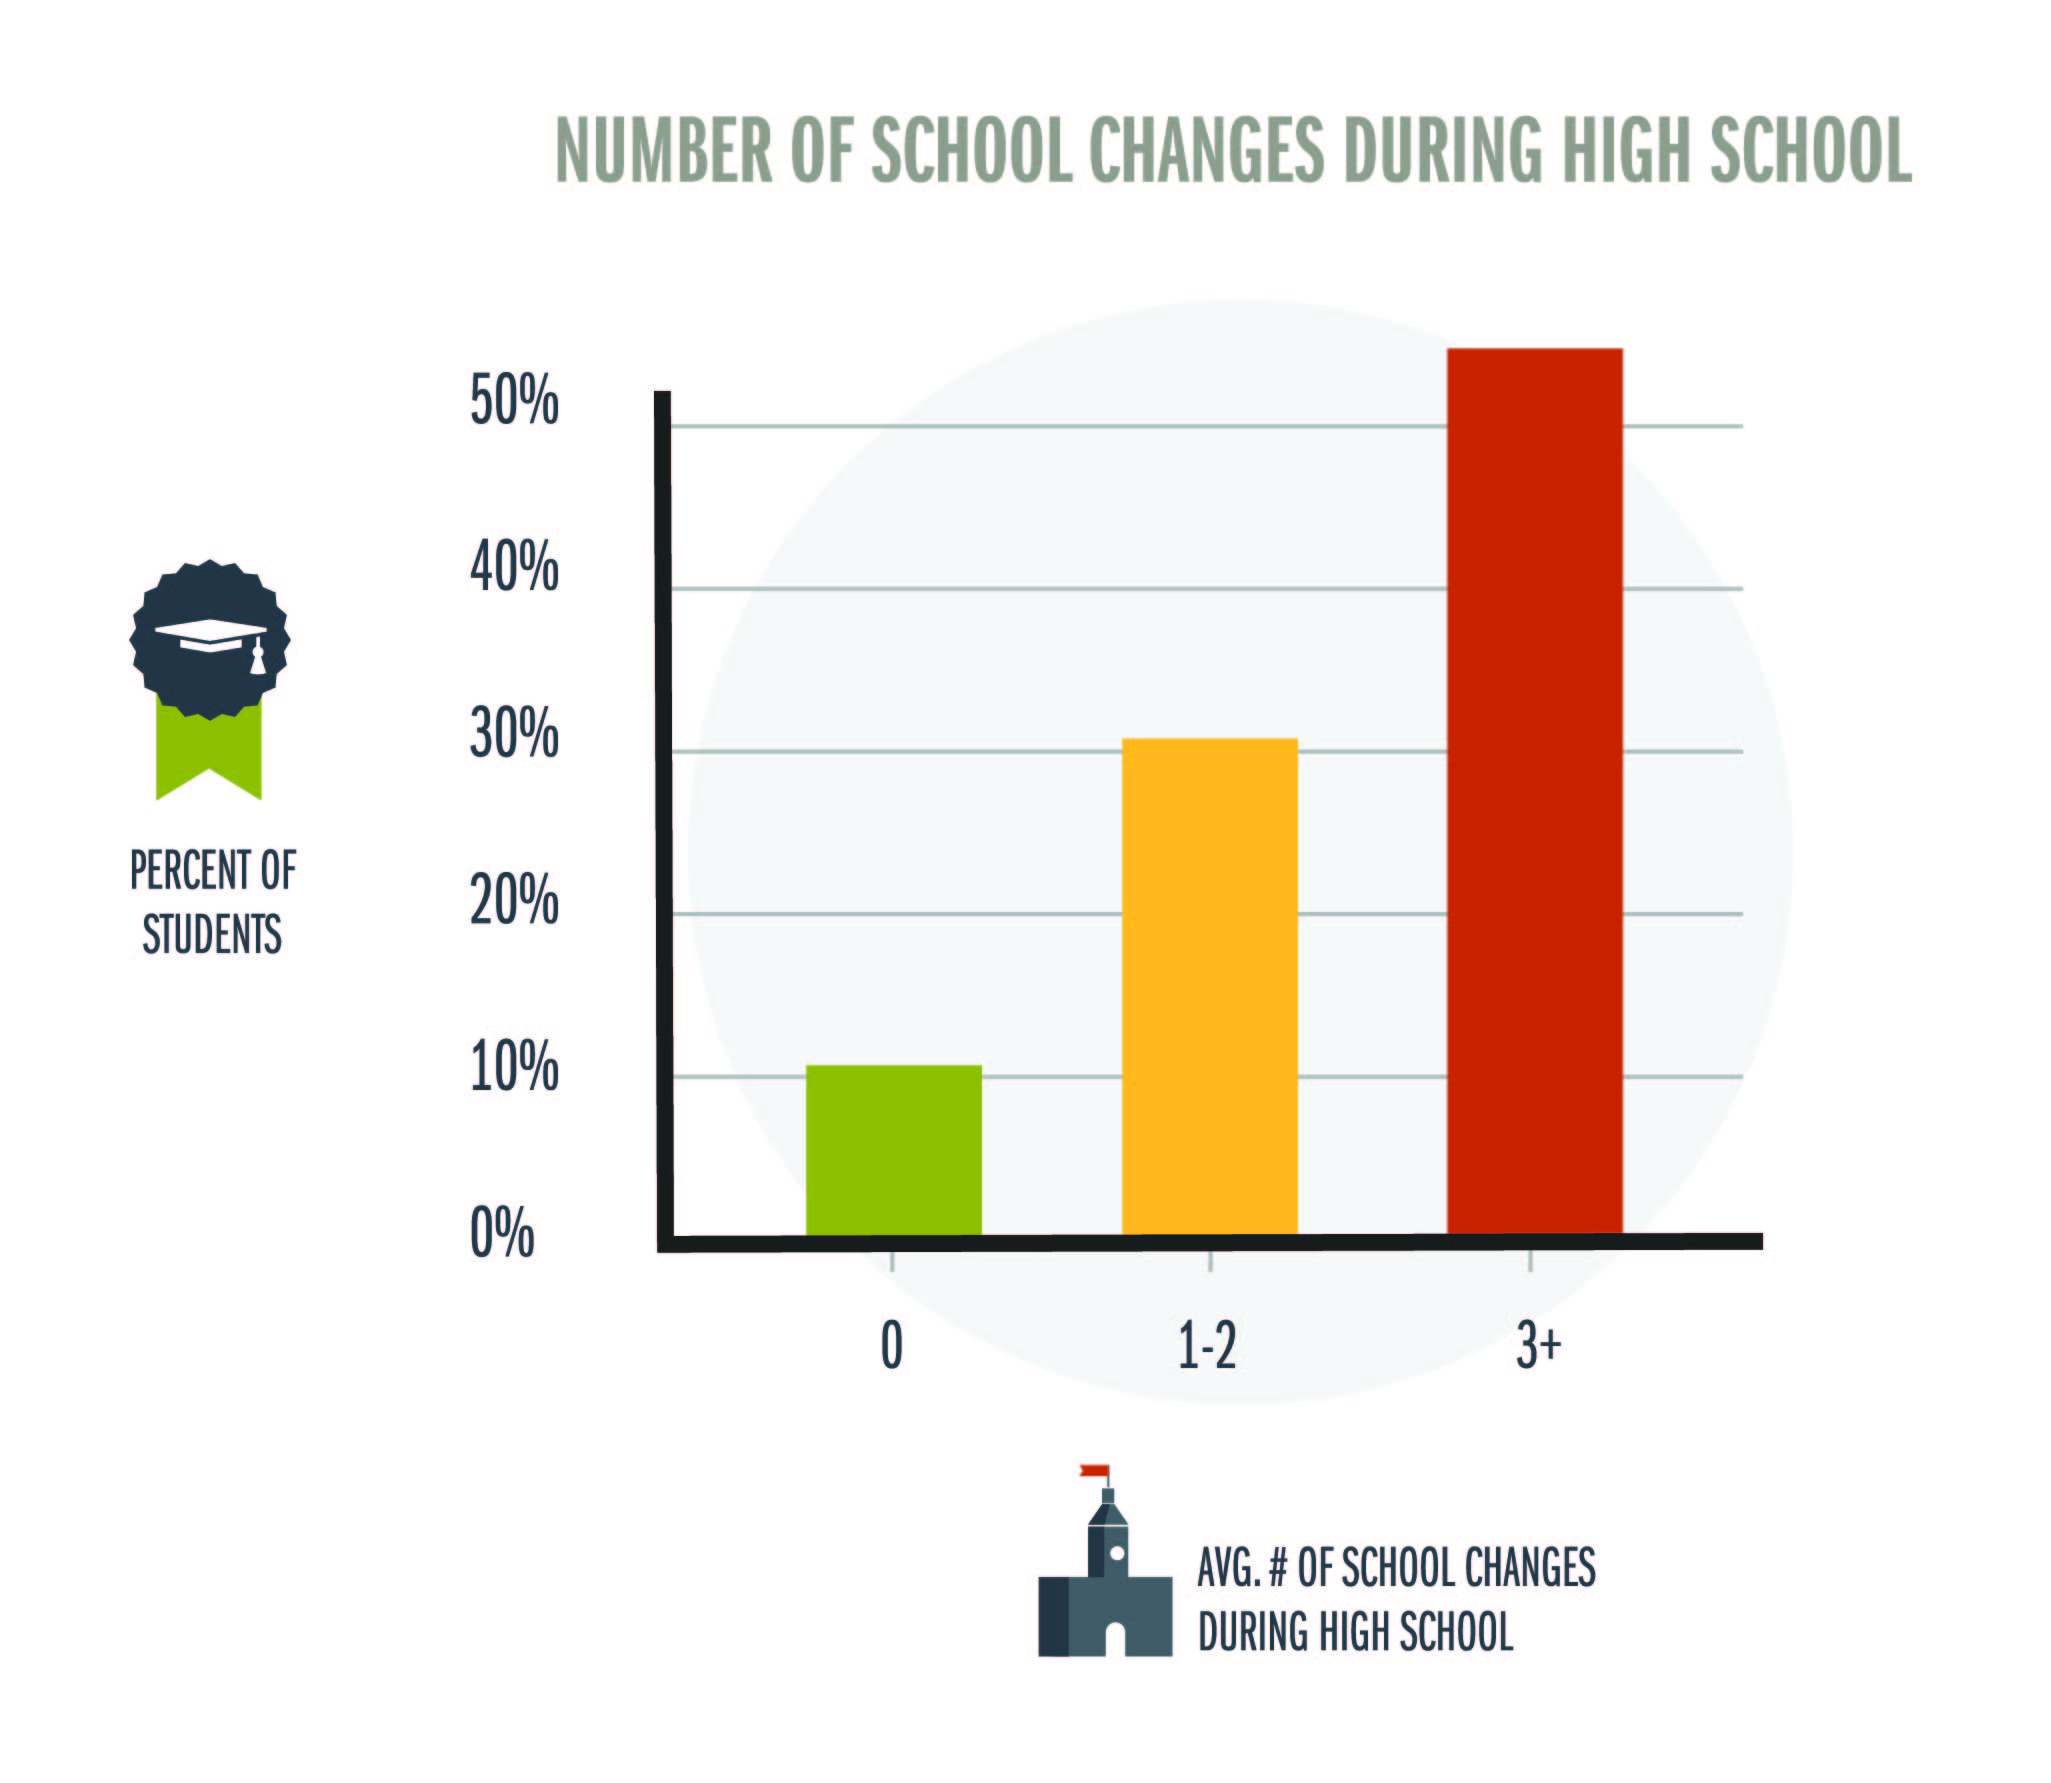
Description: More than half of students who experienced foster care during high school also changed schools three or more times. Complete distribution of number of school changes for students in the foster care Class of 2011, 2012, 2013, and 2014.


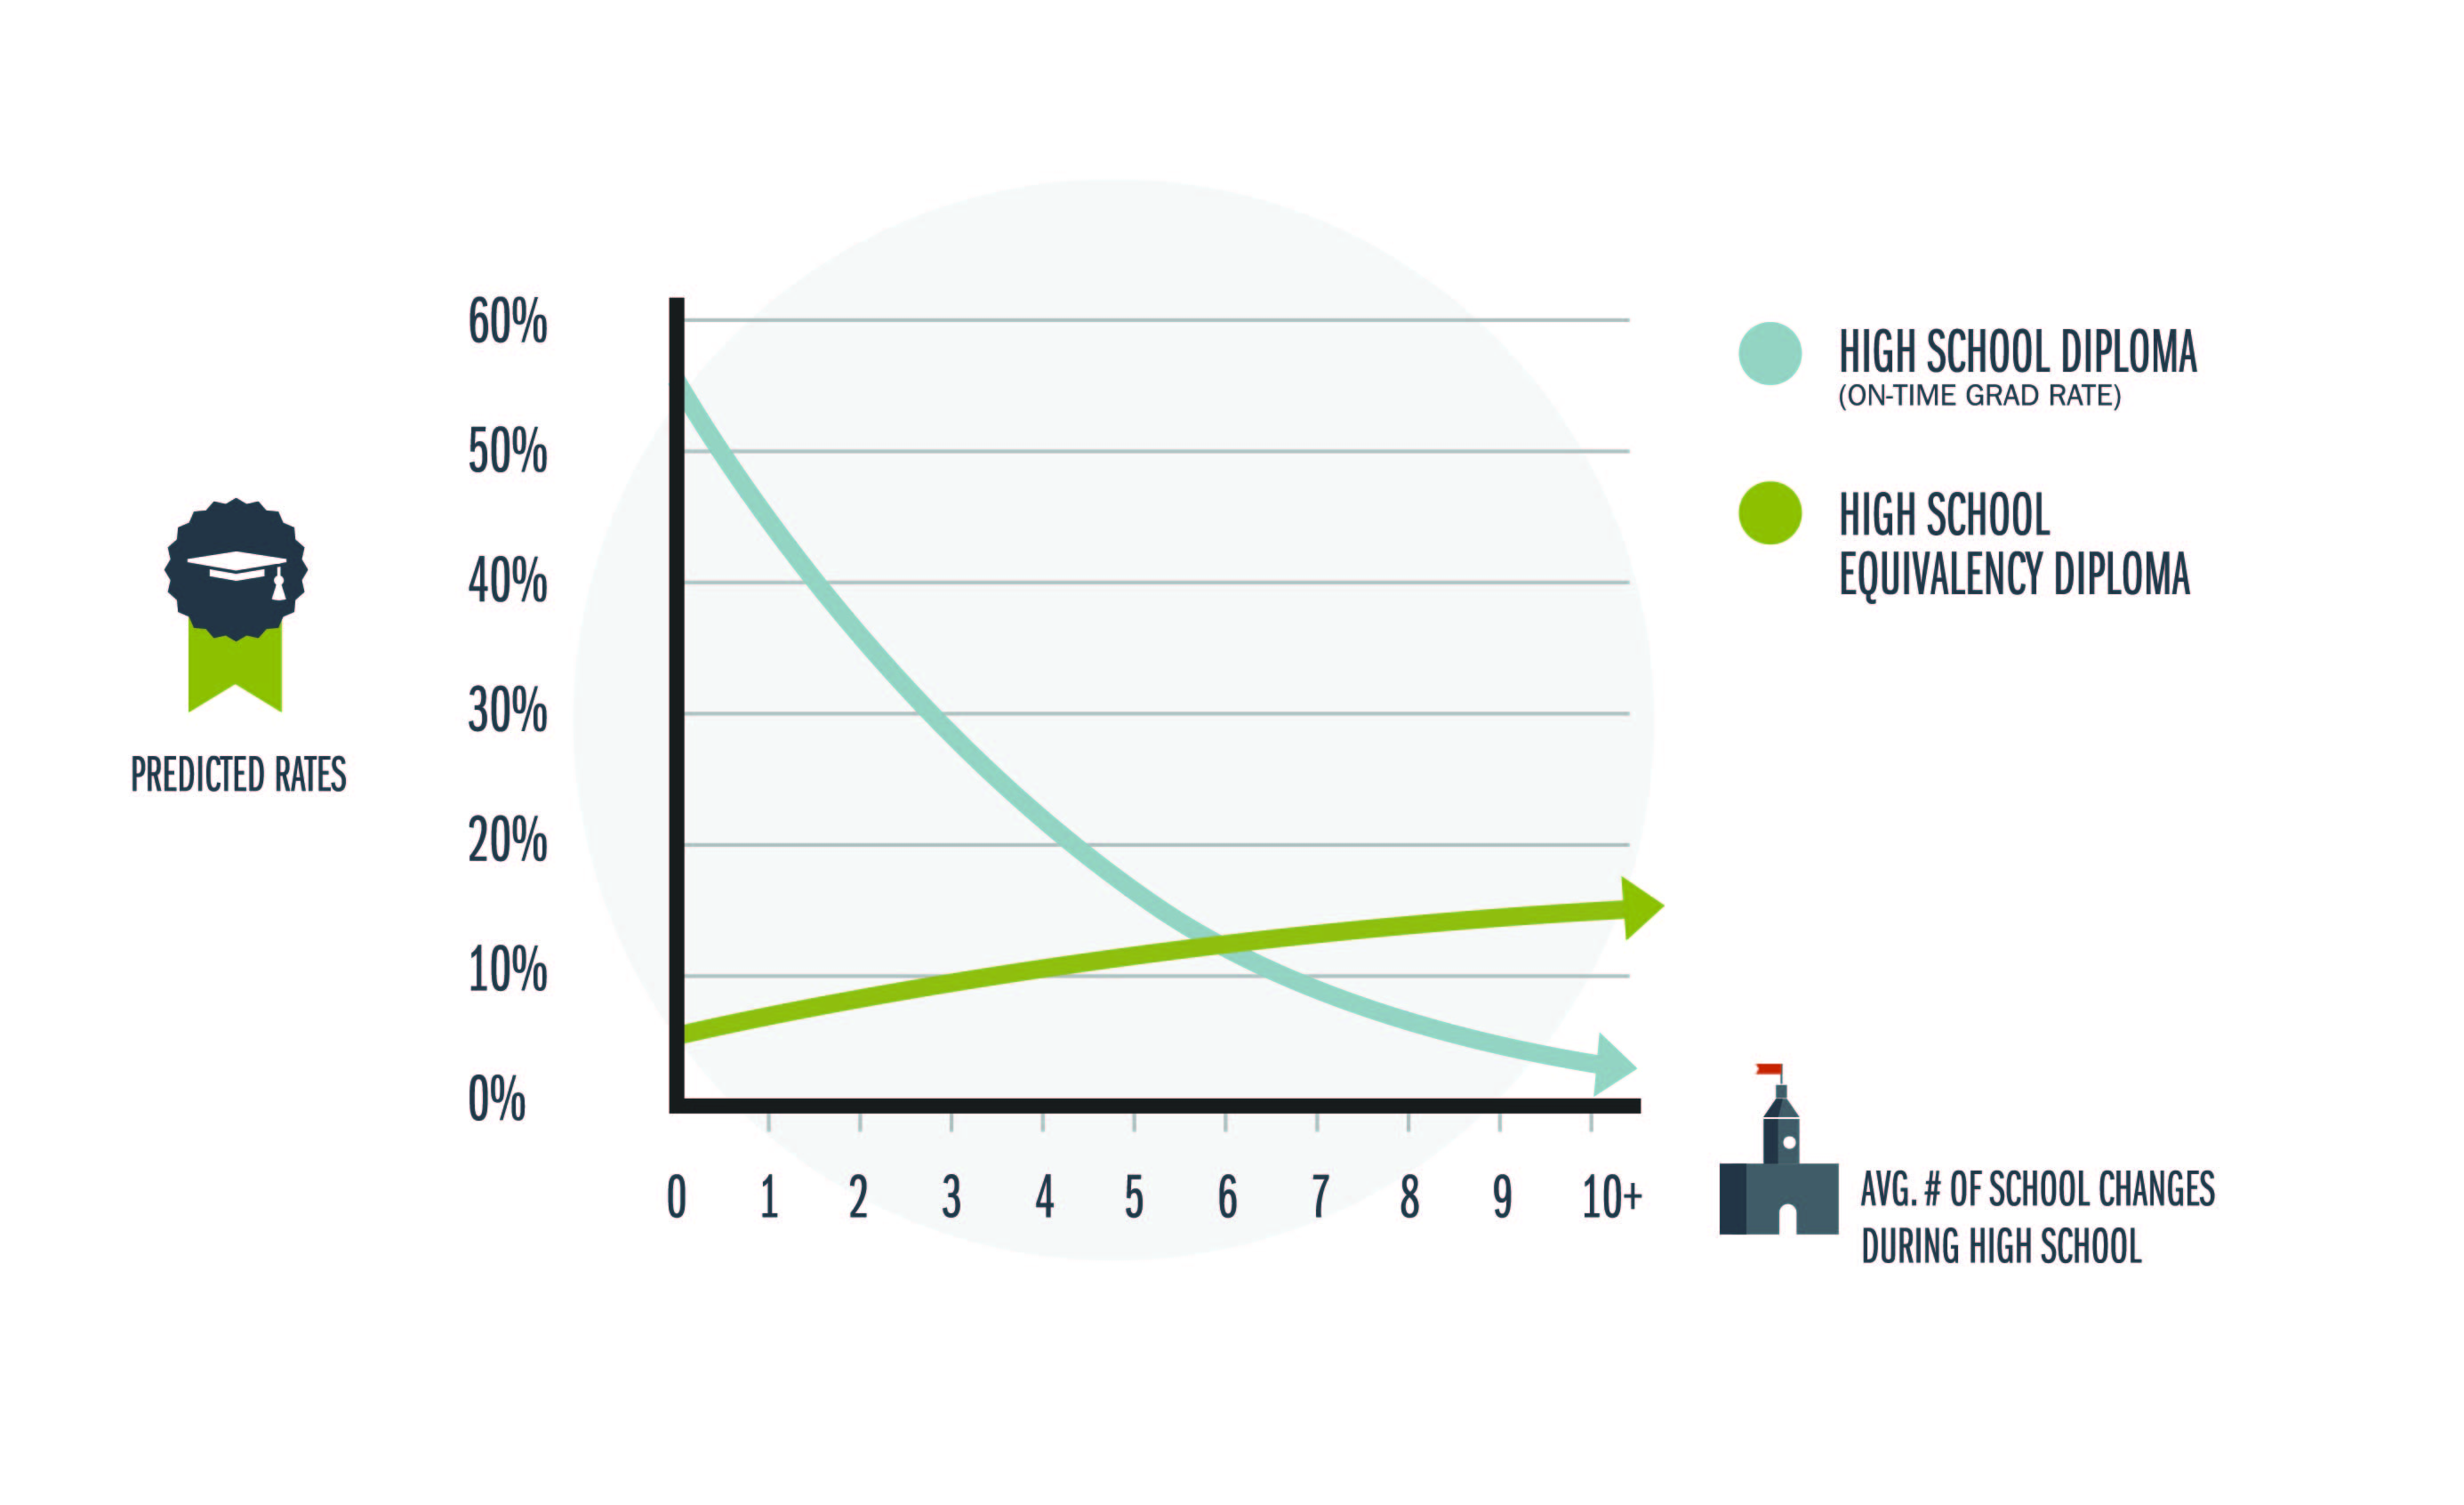
Report: Every Transition Counts (2016)
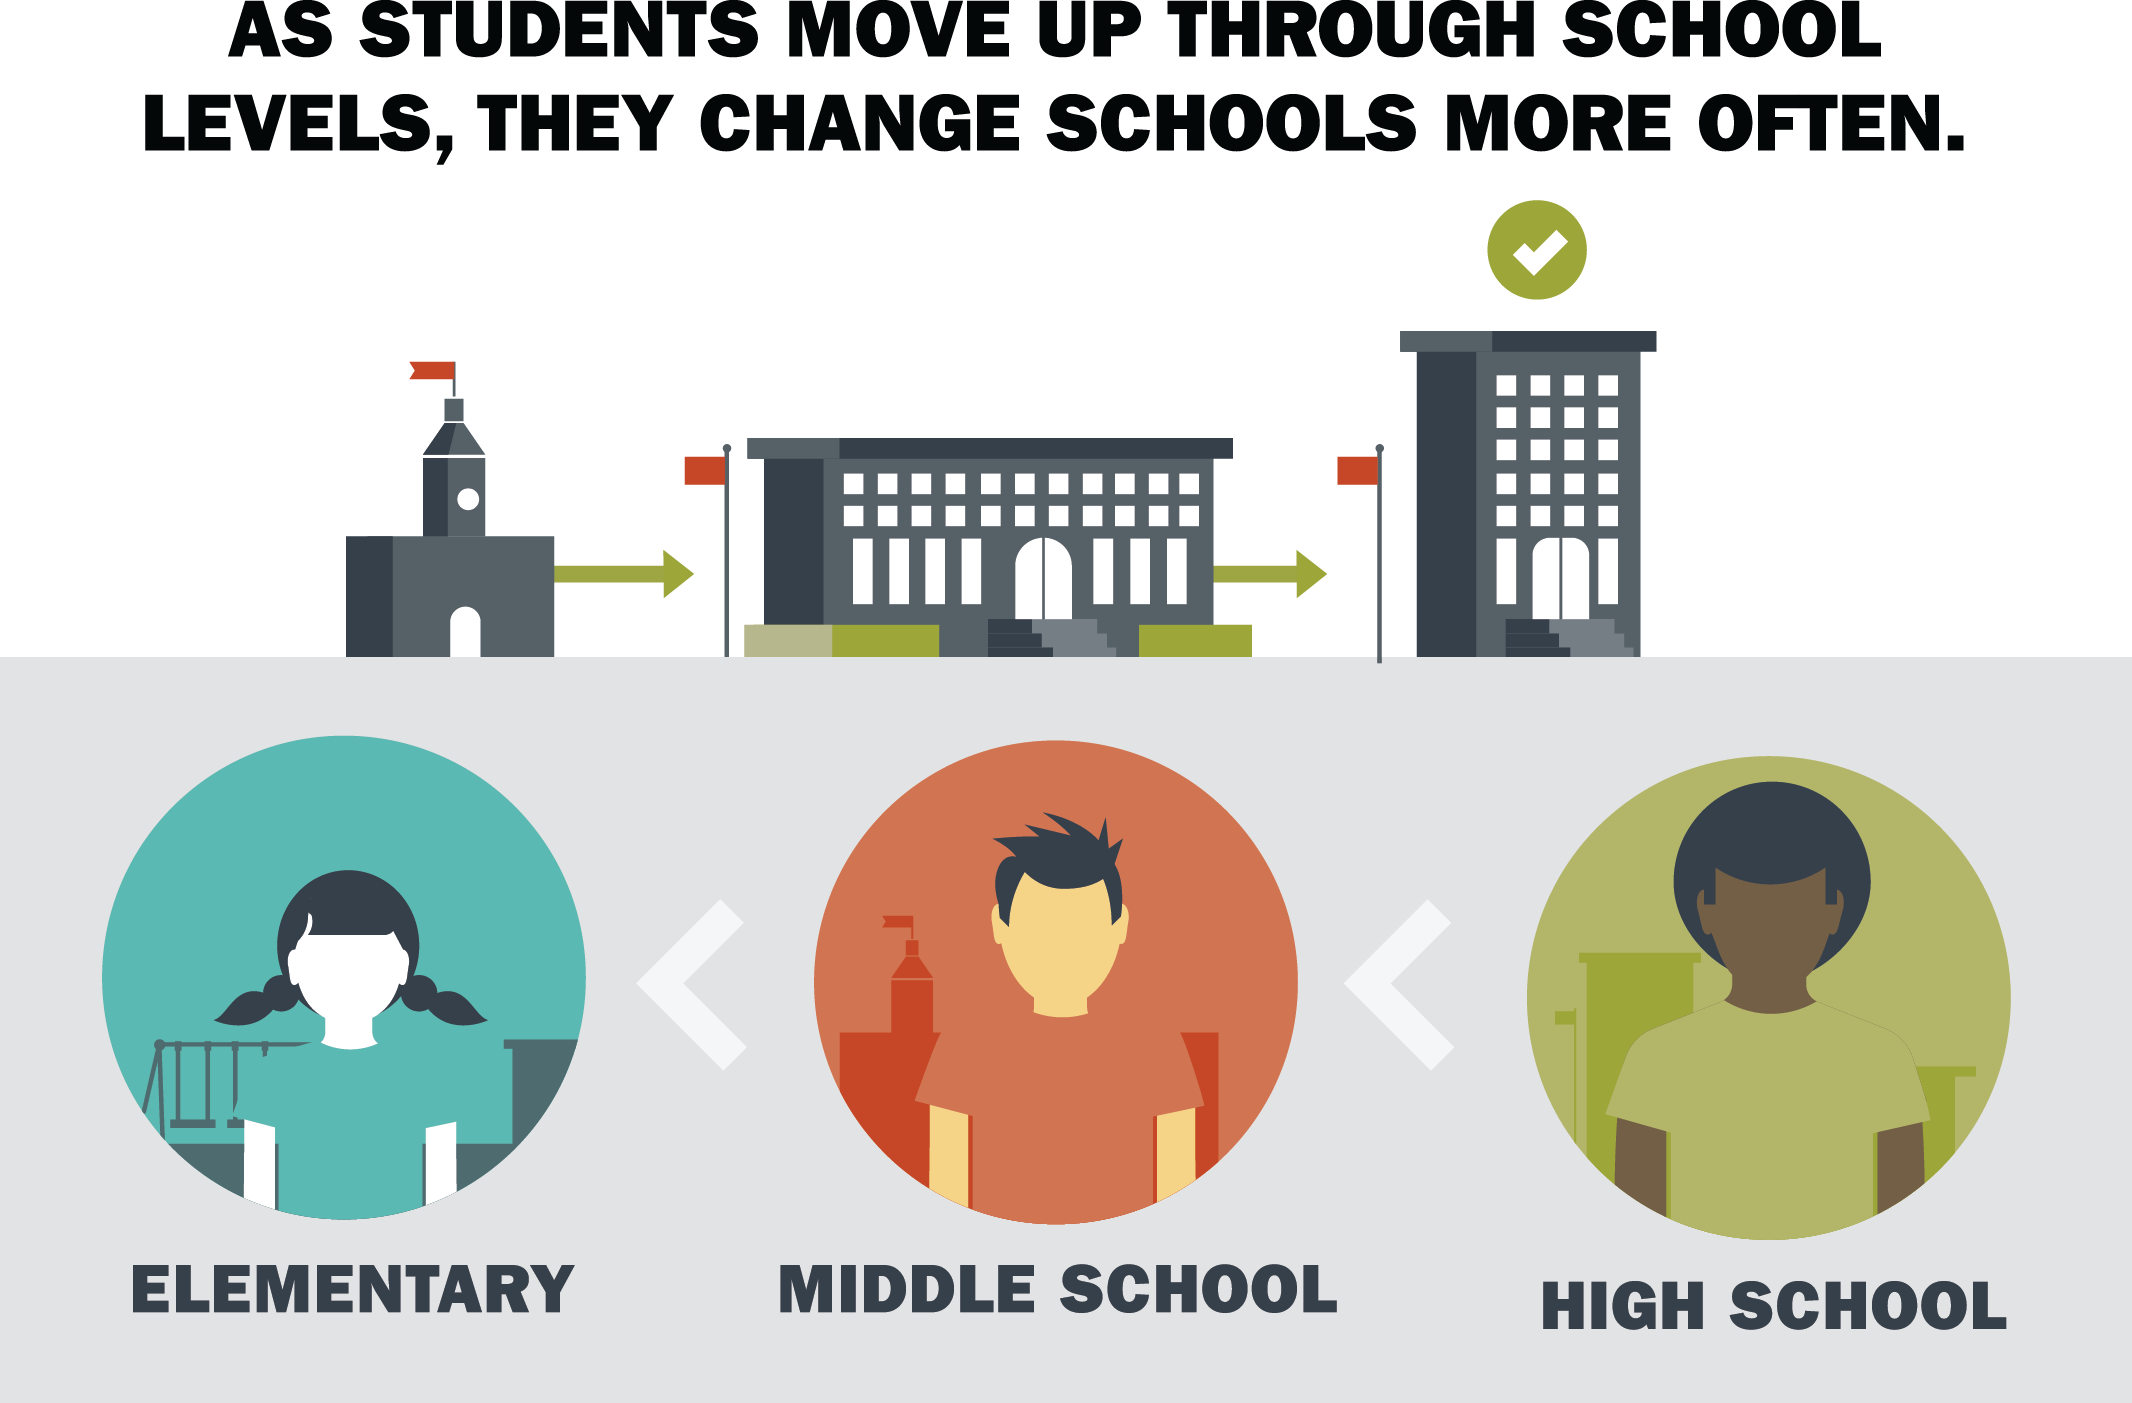
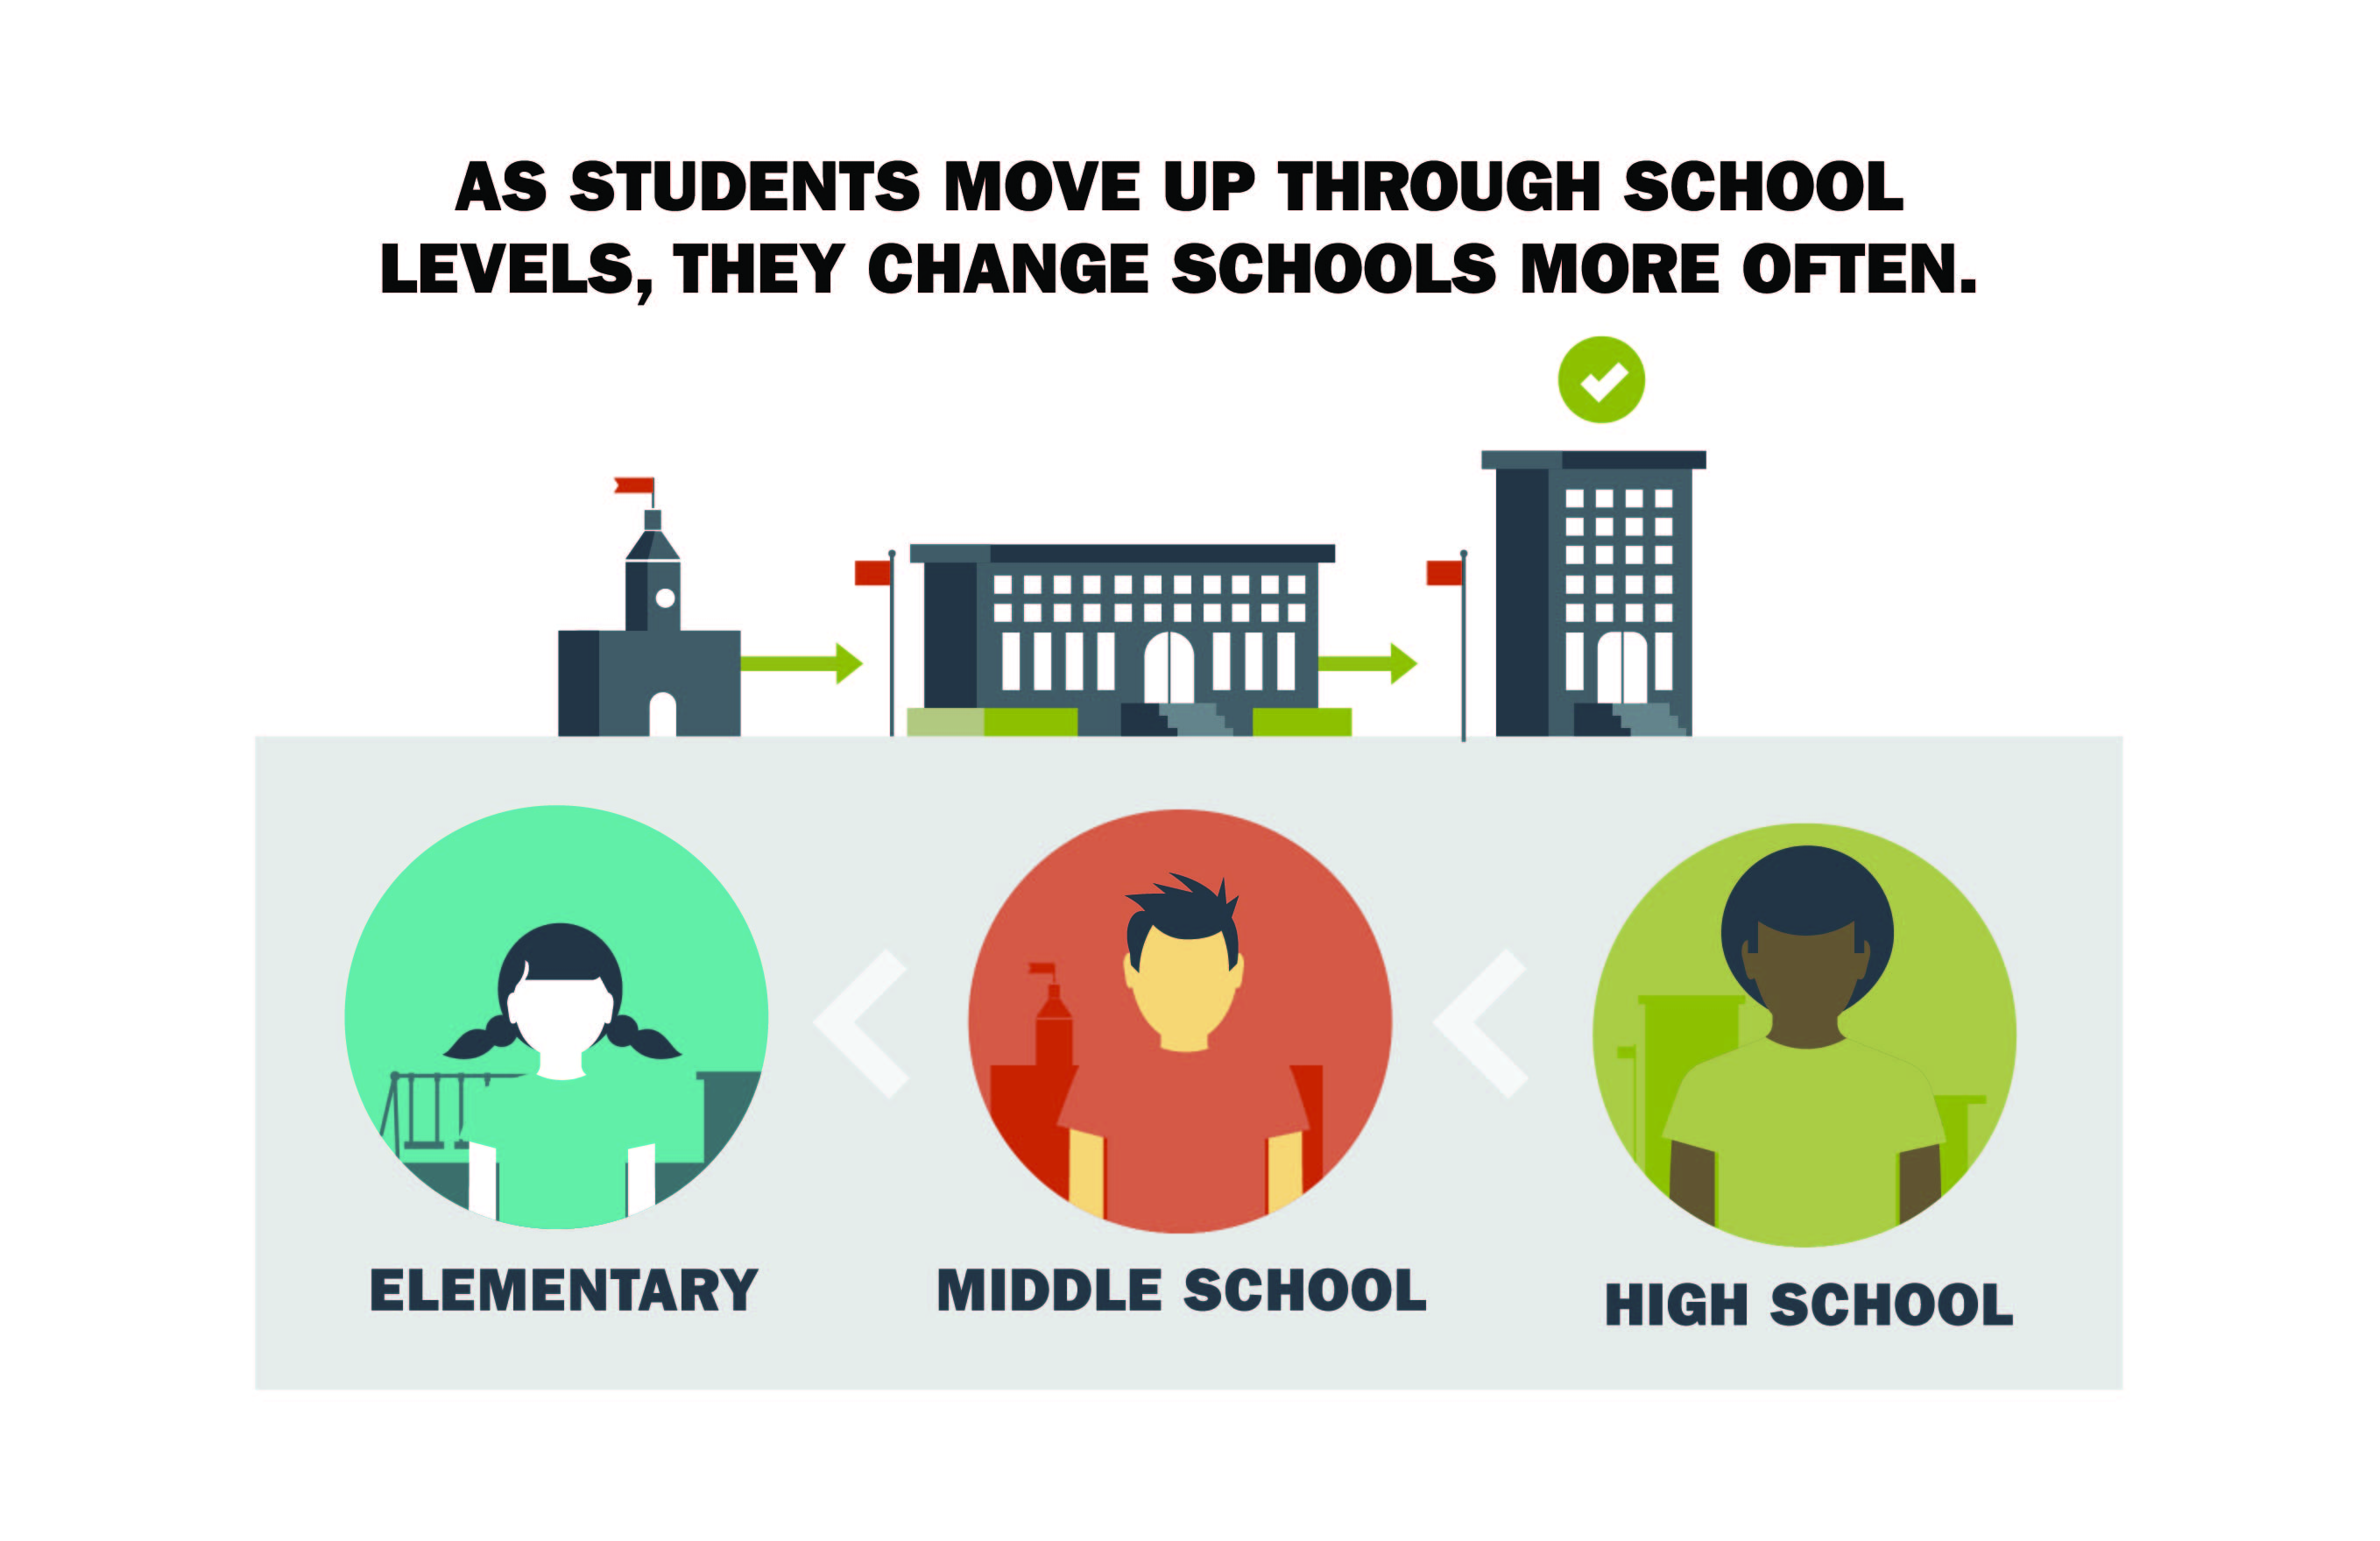
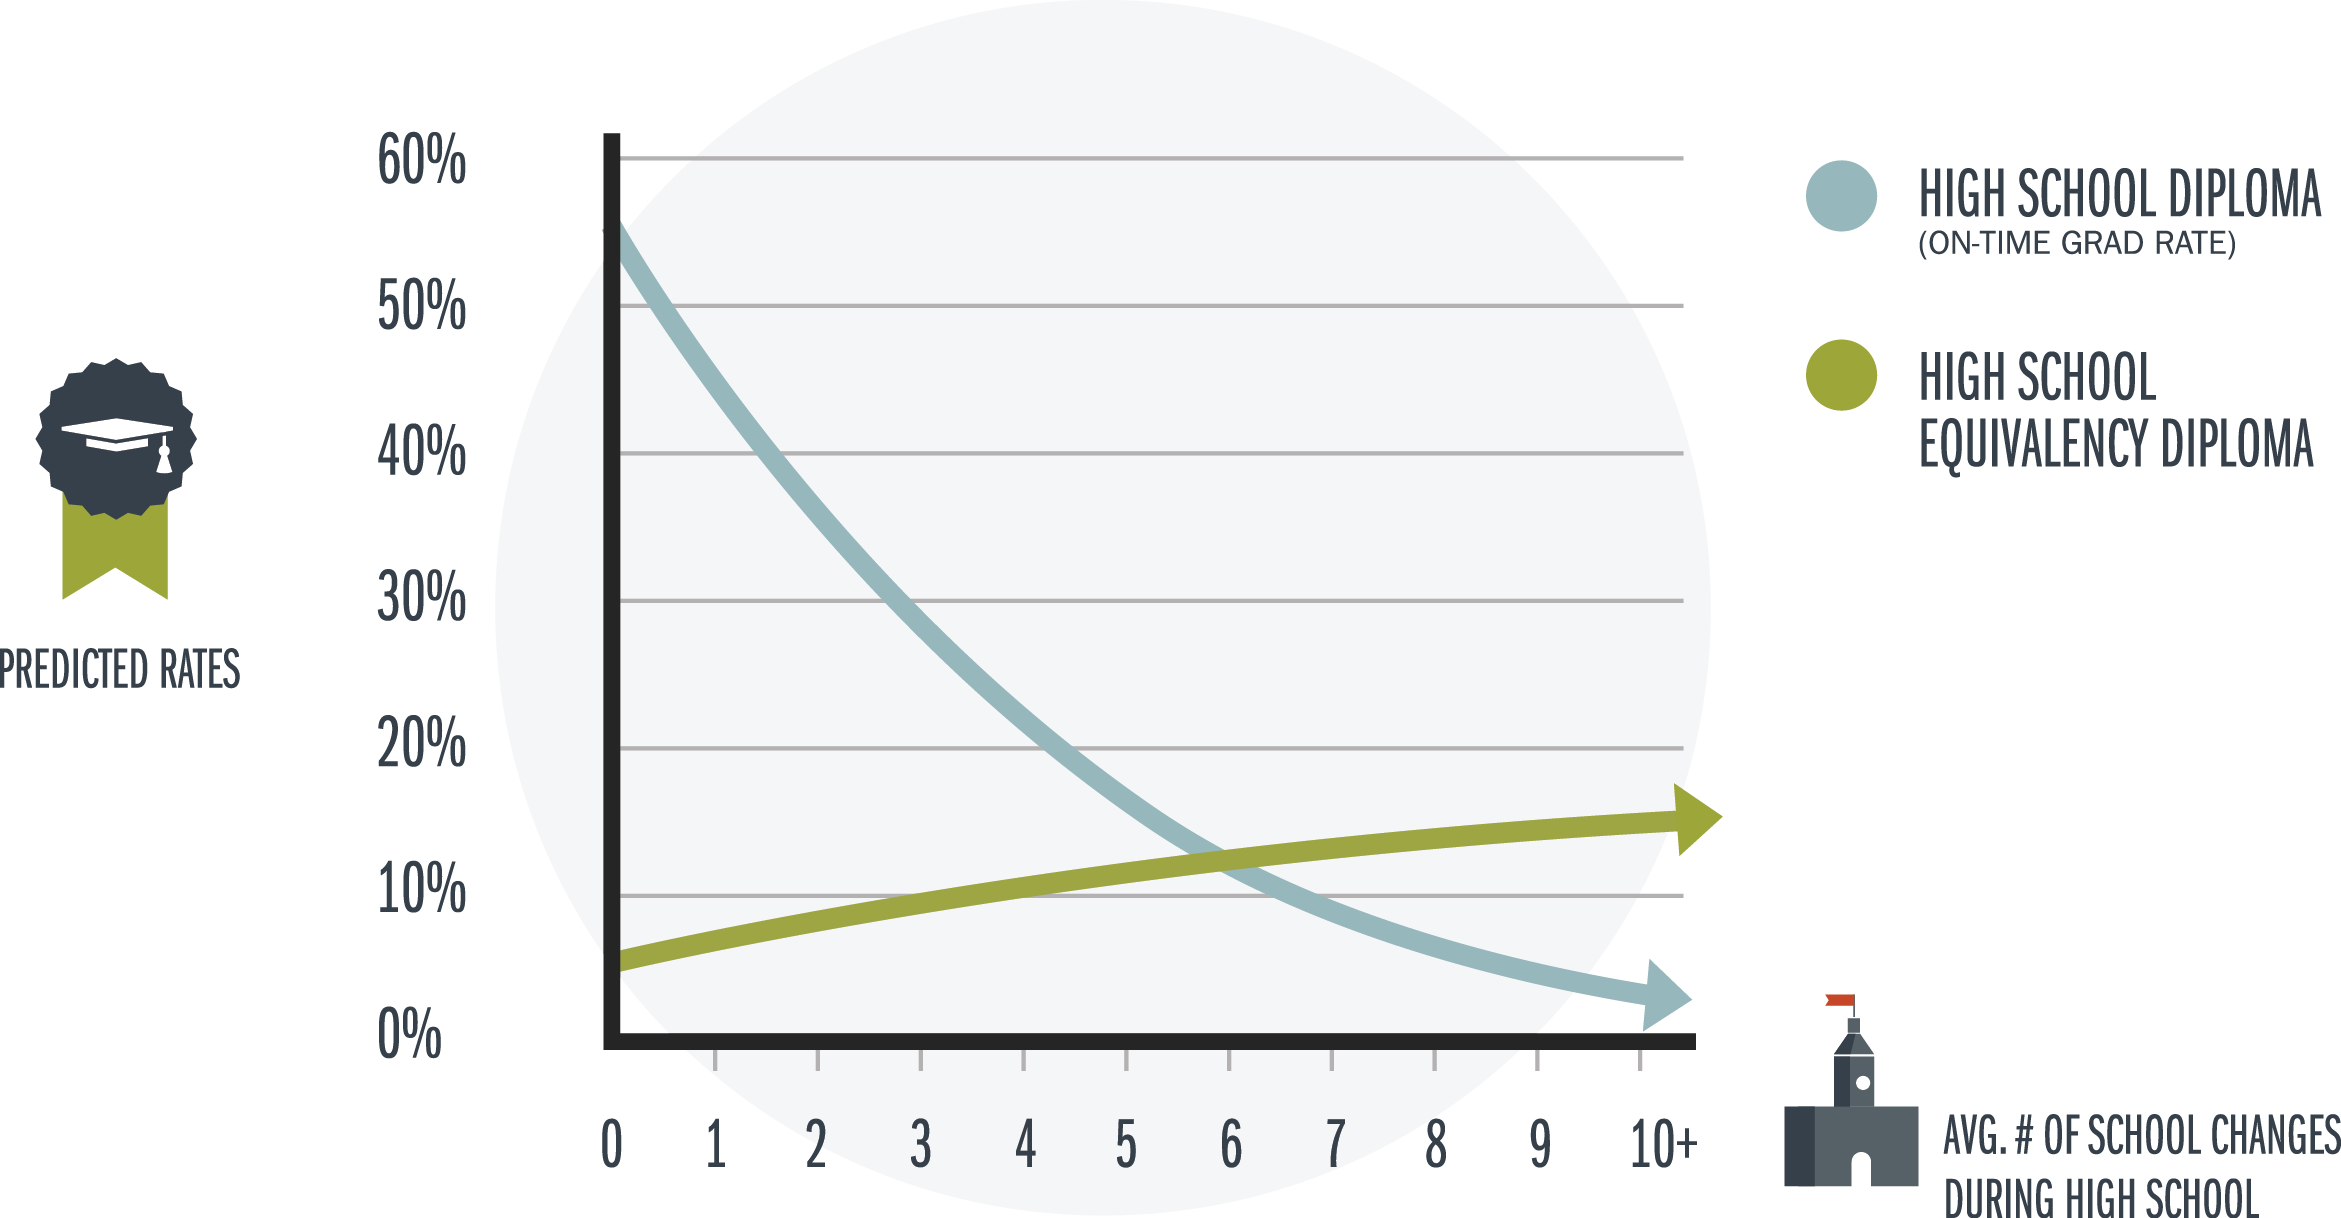
Description: Most students in foster care change schools three or more times during high school, improving educational stability is expected to increase the on-time graduation rate and decrease the percentage of students earning a high school equivalency diploma (e.g., a GED).


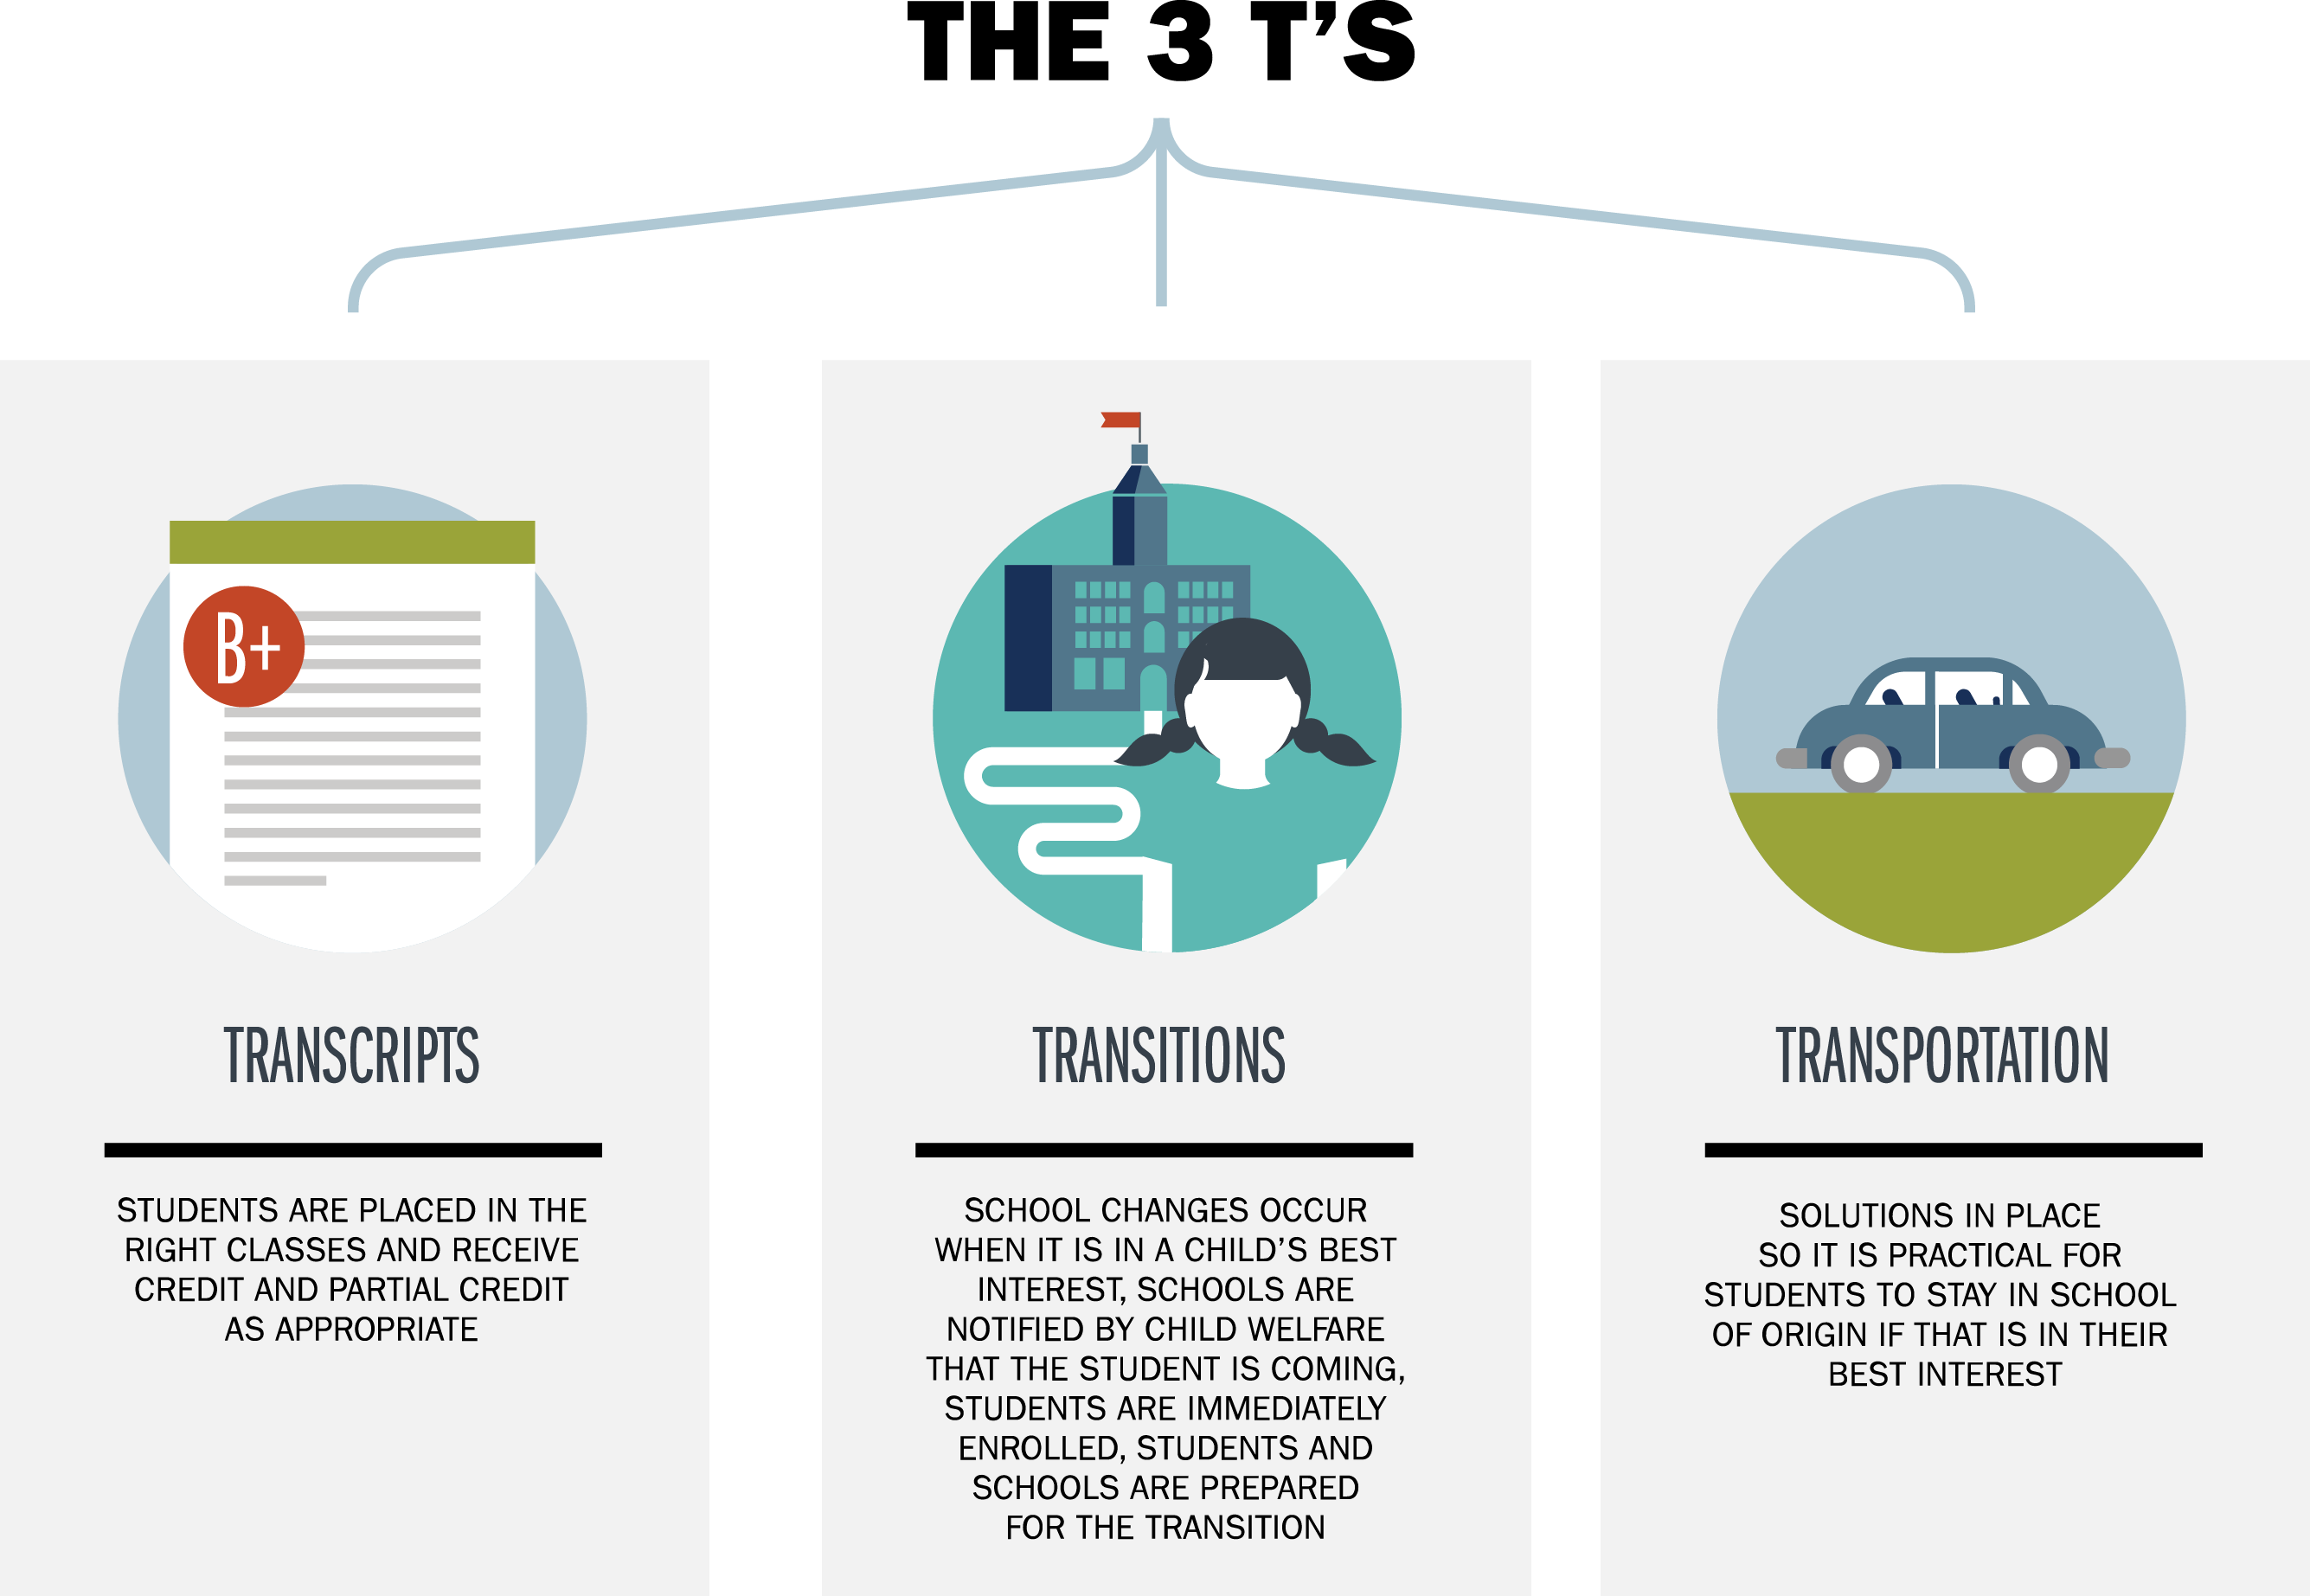
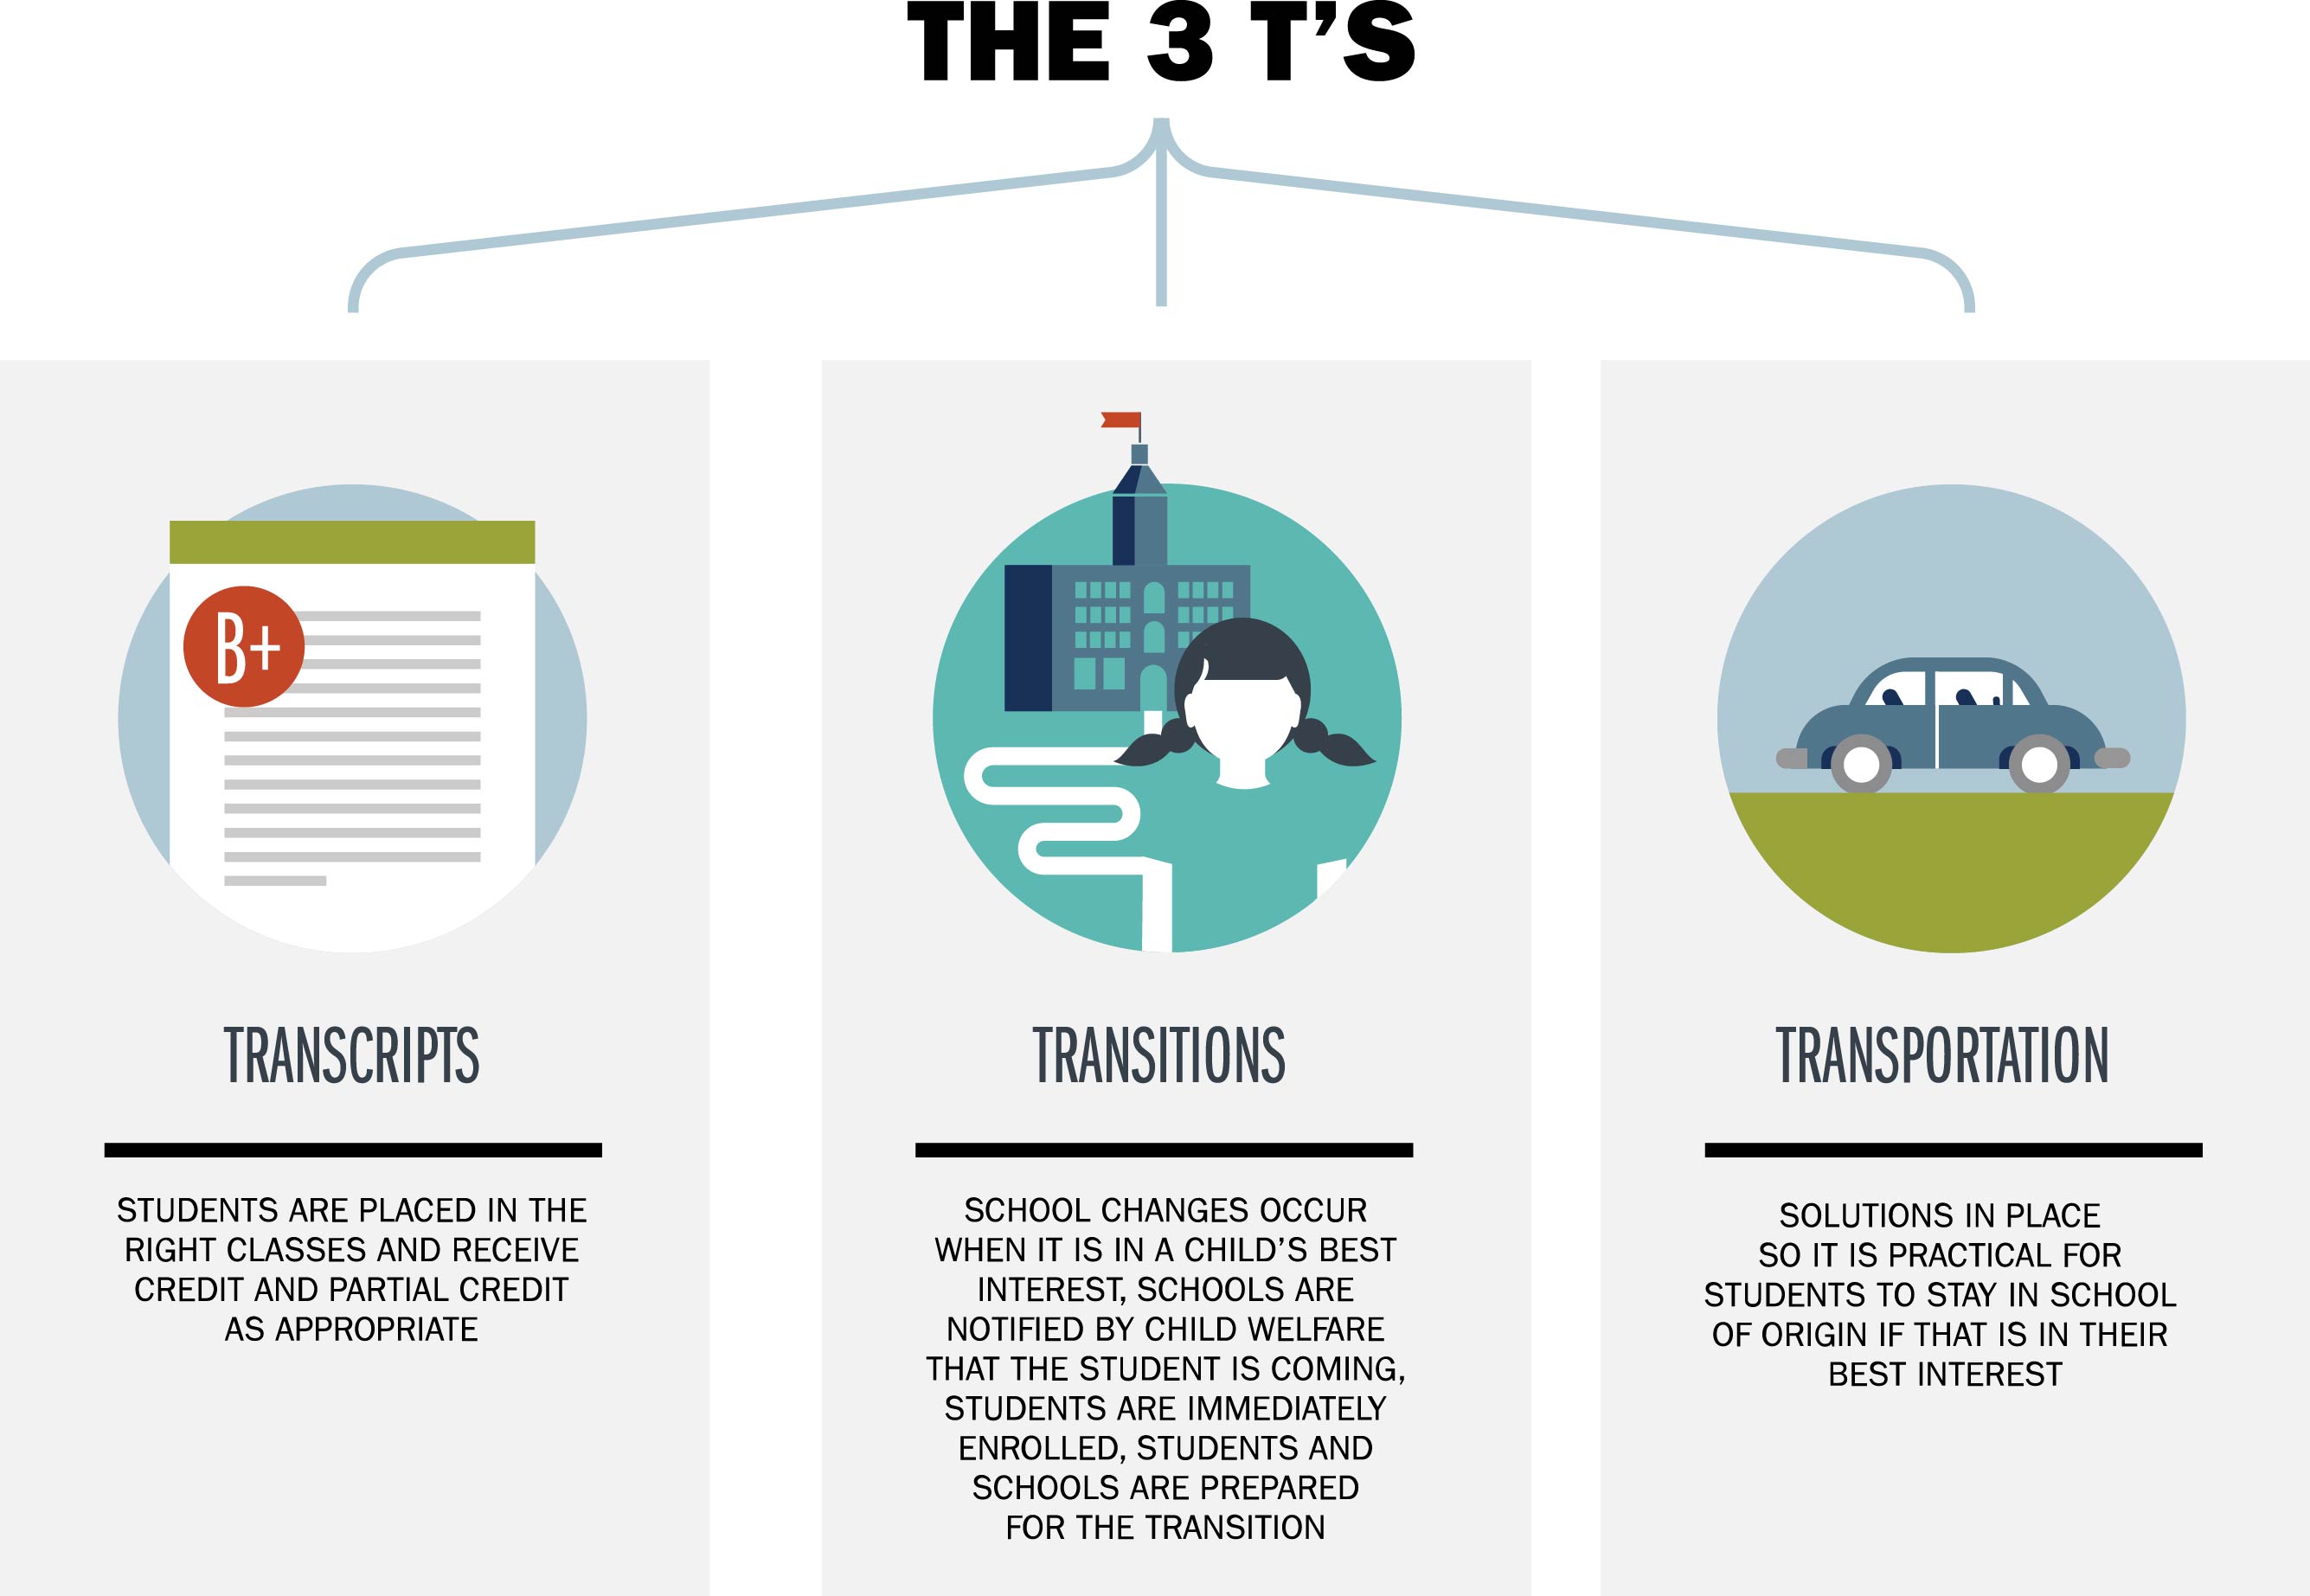
Report: Every Transition Counts (2016)
Description: Educational Stability Call to Action: Transcripts, Transitions, Transportation
 Download as
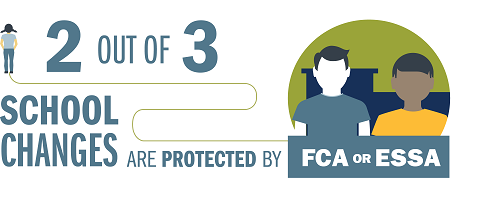
 Report: Closing the Educational Stability Policy Gap (2017)
Description: For students in foster care, two out of three school changes are protected by the provisions in FCA or ESSA.
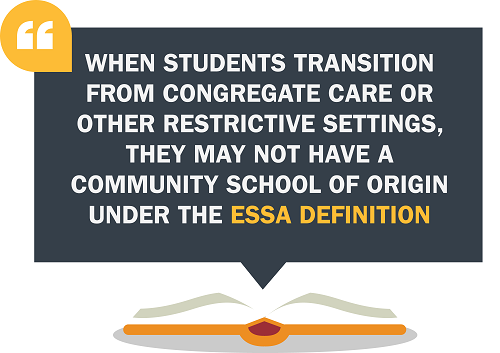
Report: Closing the Educational Stability Policy Gap (2017)
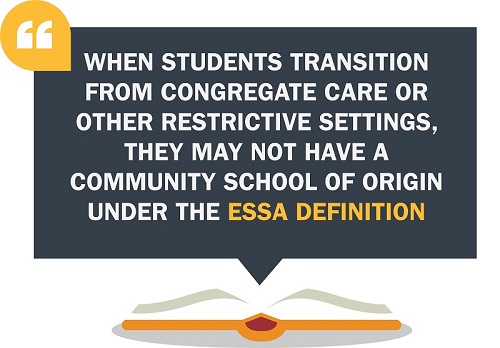
Description: When students transition from congregate care or other restrictive settings, they may not have a community school of origin under the ESSA definition.
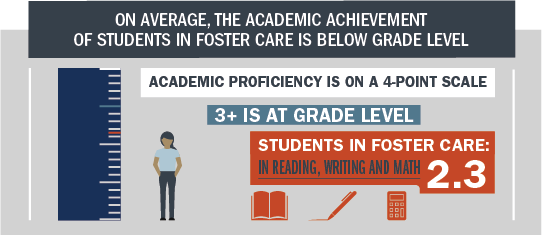
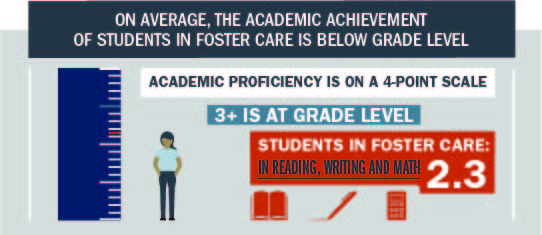
Report: Closing the Achievement Gap for students in foster care (2018)
Description: Academic proficiency is measured on a 4-point scale, with scores of 3 or above considered to be “at grade level.” Students in foster care average around 2.3 in reading, writing, and math.
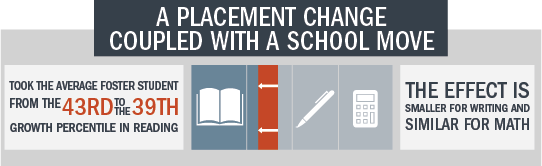
Report: Closing the Achievement Gap for students in foster care (2018)
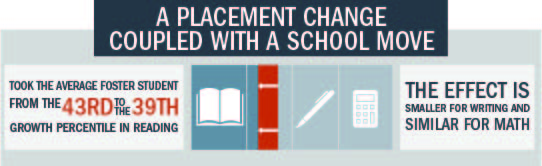
Description: A placement change coupled with a school move takes the average foster student from the 43rd to the 39th growth percentile in reading. The effect is smaller for writing and similar for math.
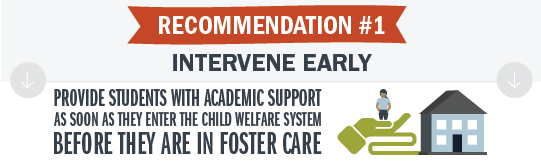
Report: Closing the Achievement Gap for students in foster care (2018)
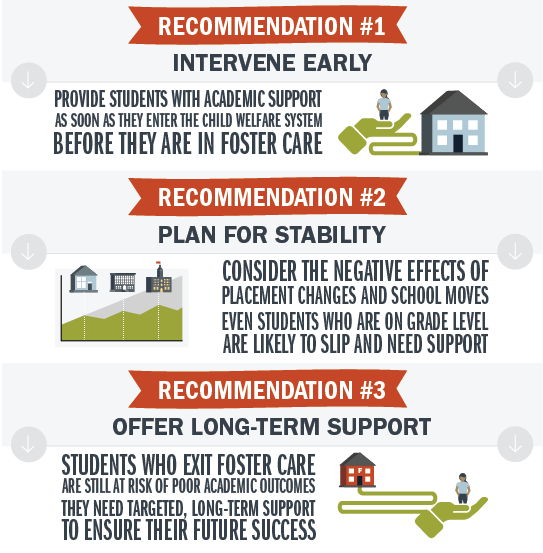
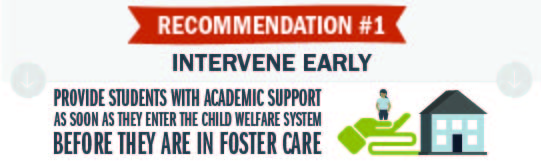
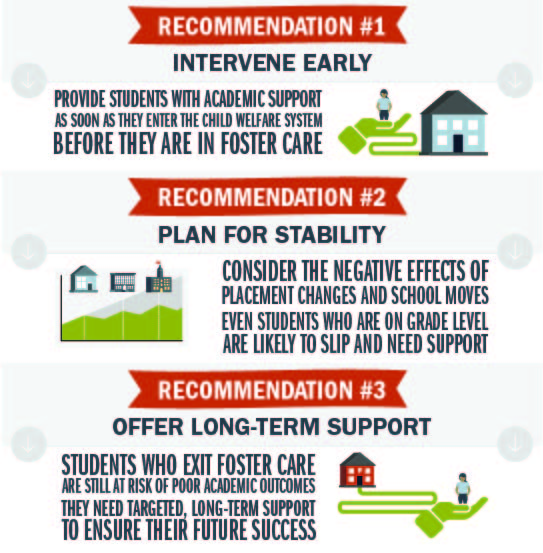
Description: Recommendation #1: Intervene early. Students need academic support as soon as they enter the child welfare system before they are in foster care.
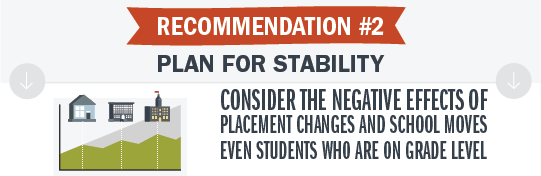
Report: Closing the Achievement Gap for students in foster care (2018)
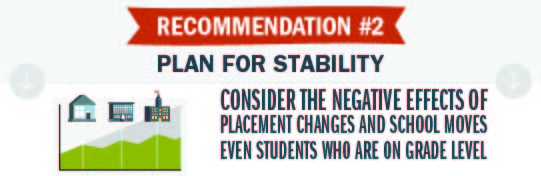
Description: Recommendation #2: Plan for stability. Take into consideration the negative effects that placement changes and school moves have, even for students who are on grade level.
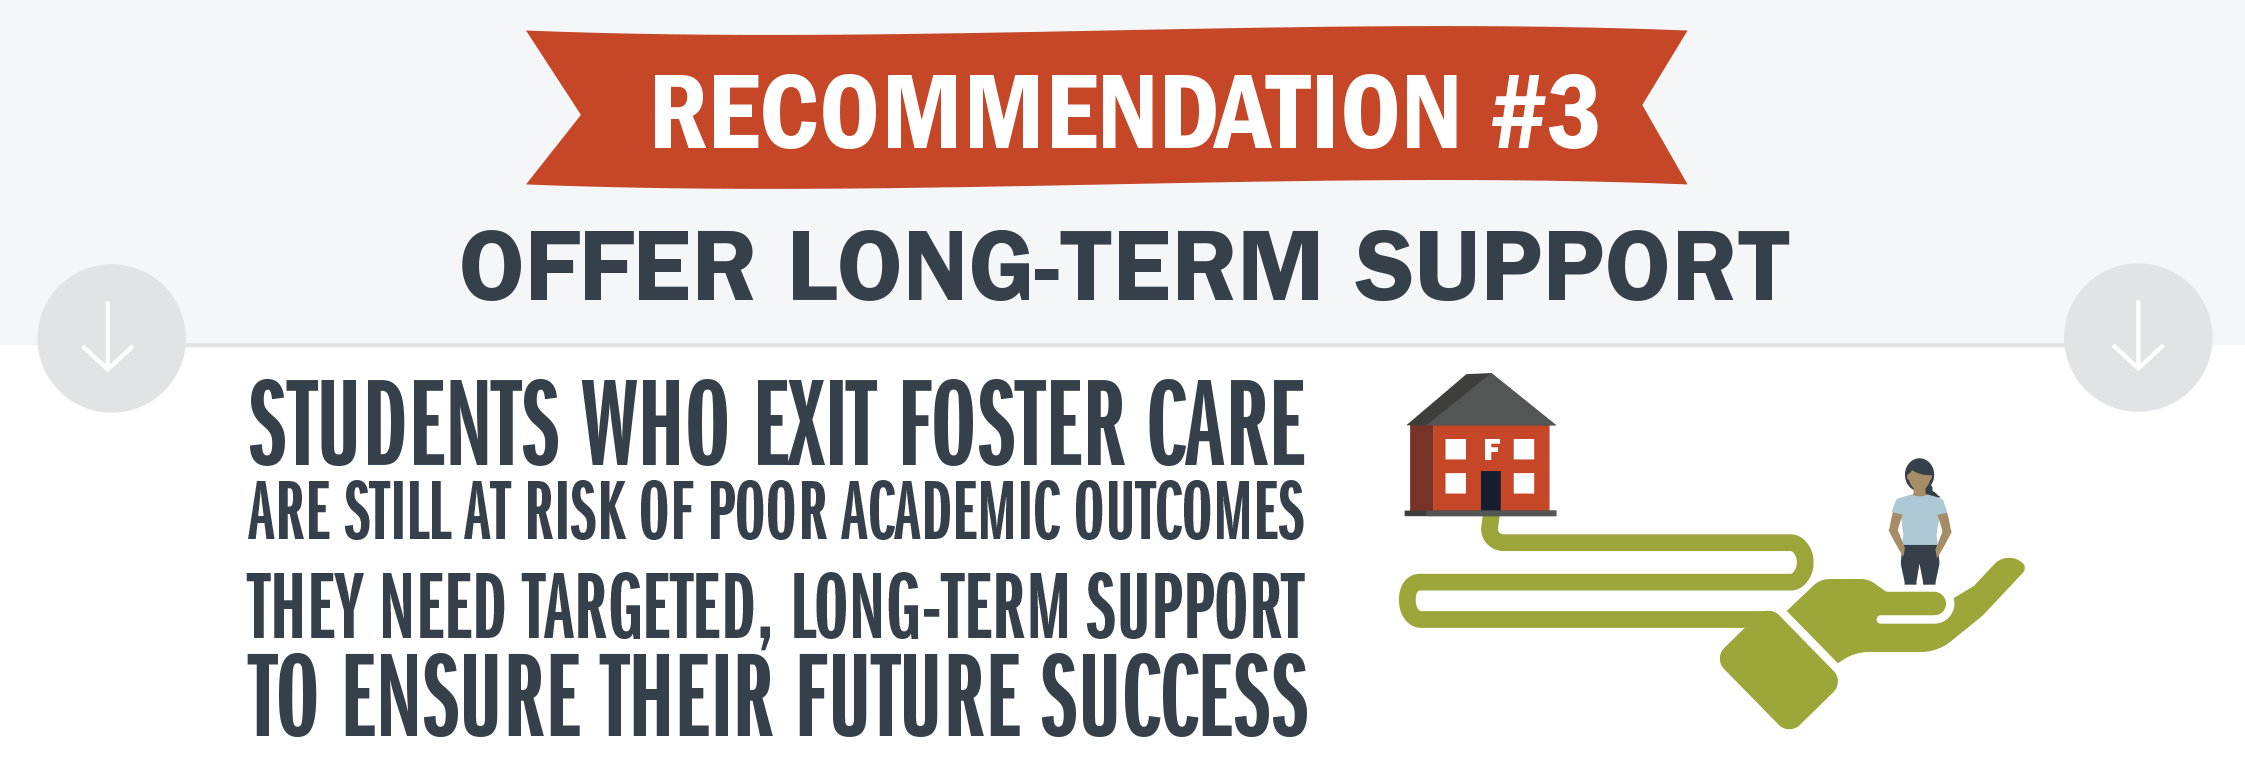
Report: Closing the Achievement Gap for students in foster care (2018)
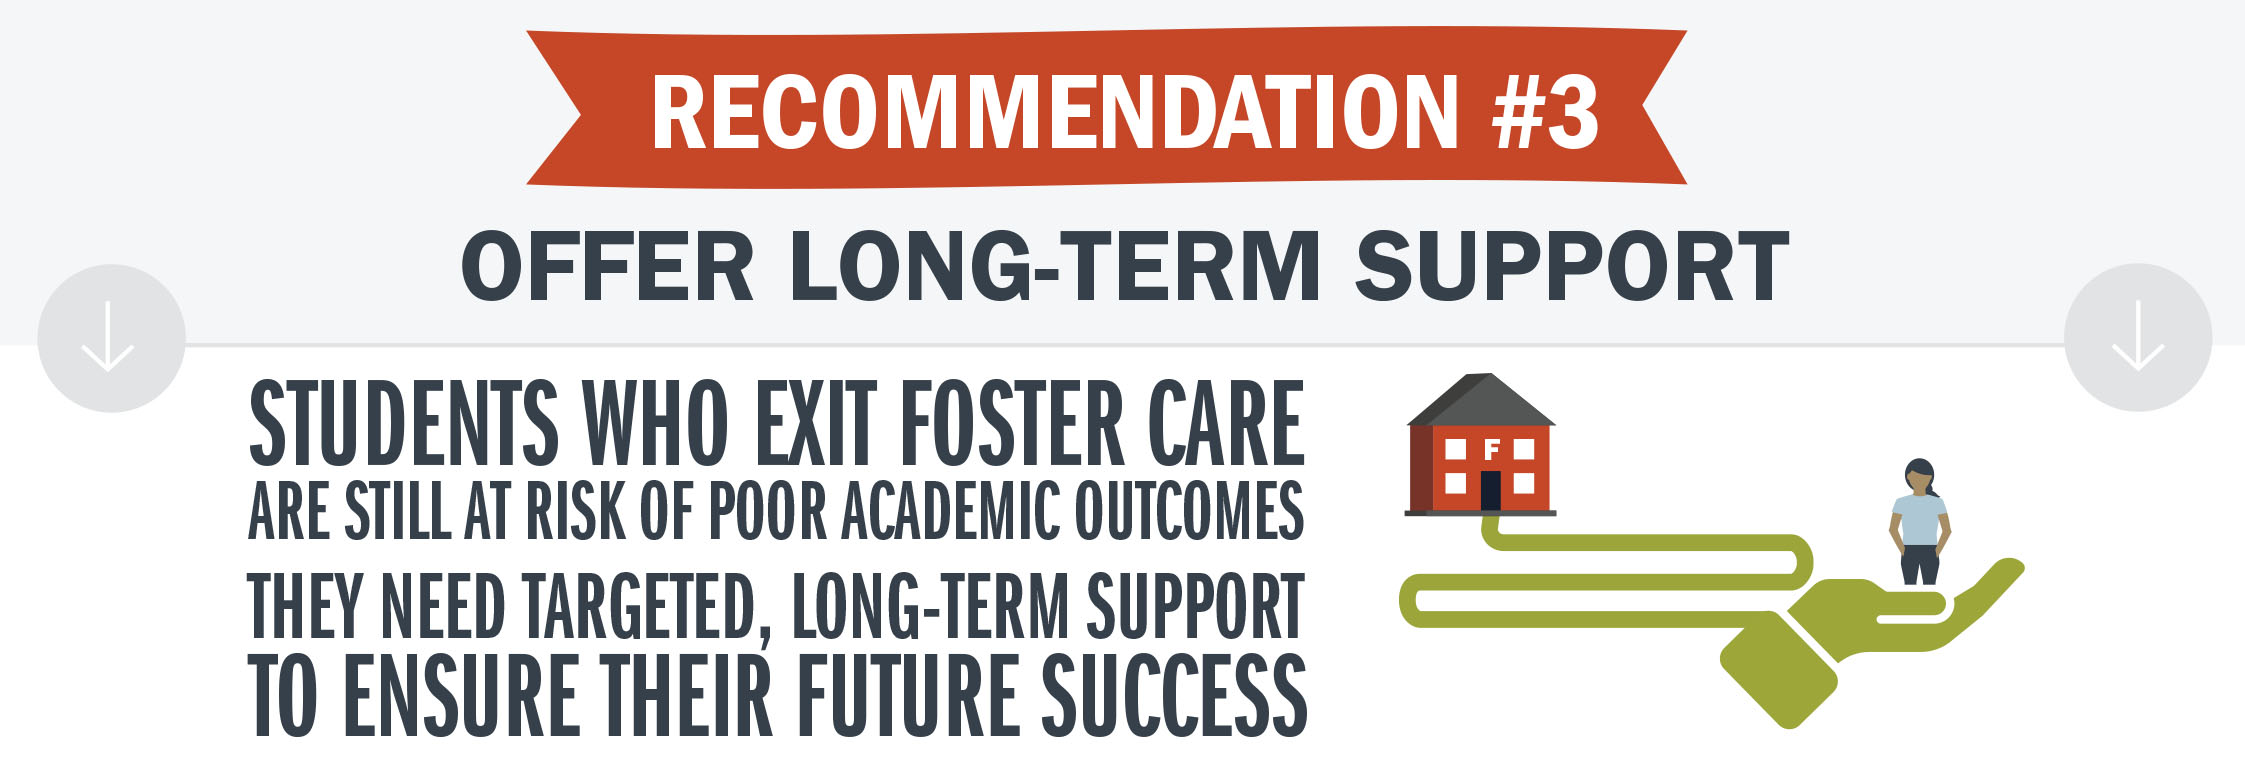
Description: Recommendation #3: Offer long-term support. Students who exit foster care are still at risk of poor academic outcomes; they need targeted, long-term support to ensure their future success.

 Download as
 Report: Every Transition Counts (2016)
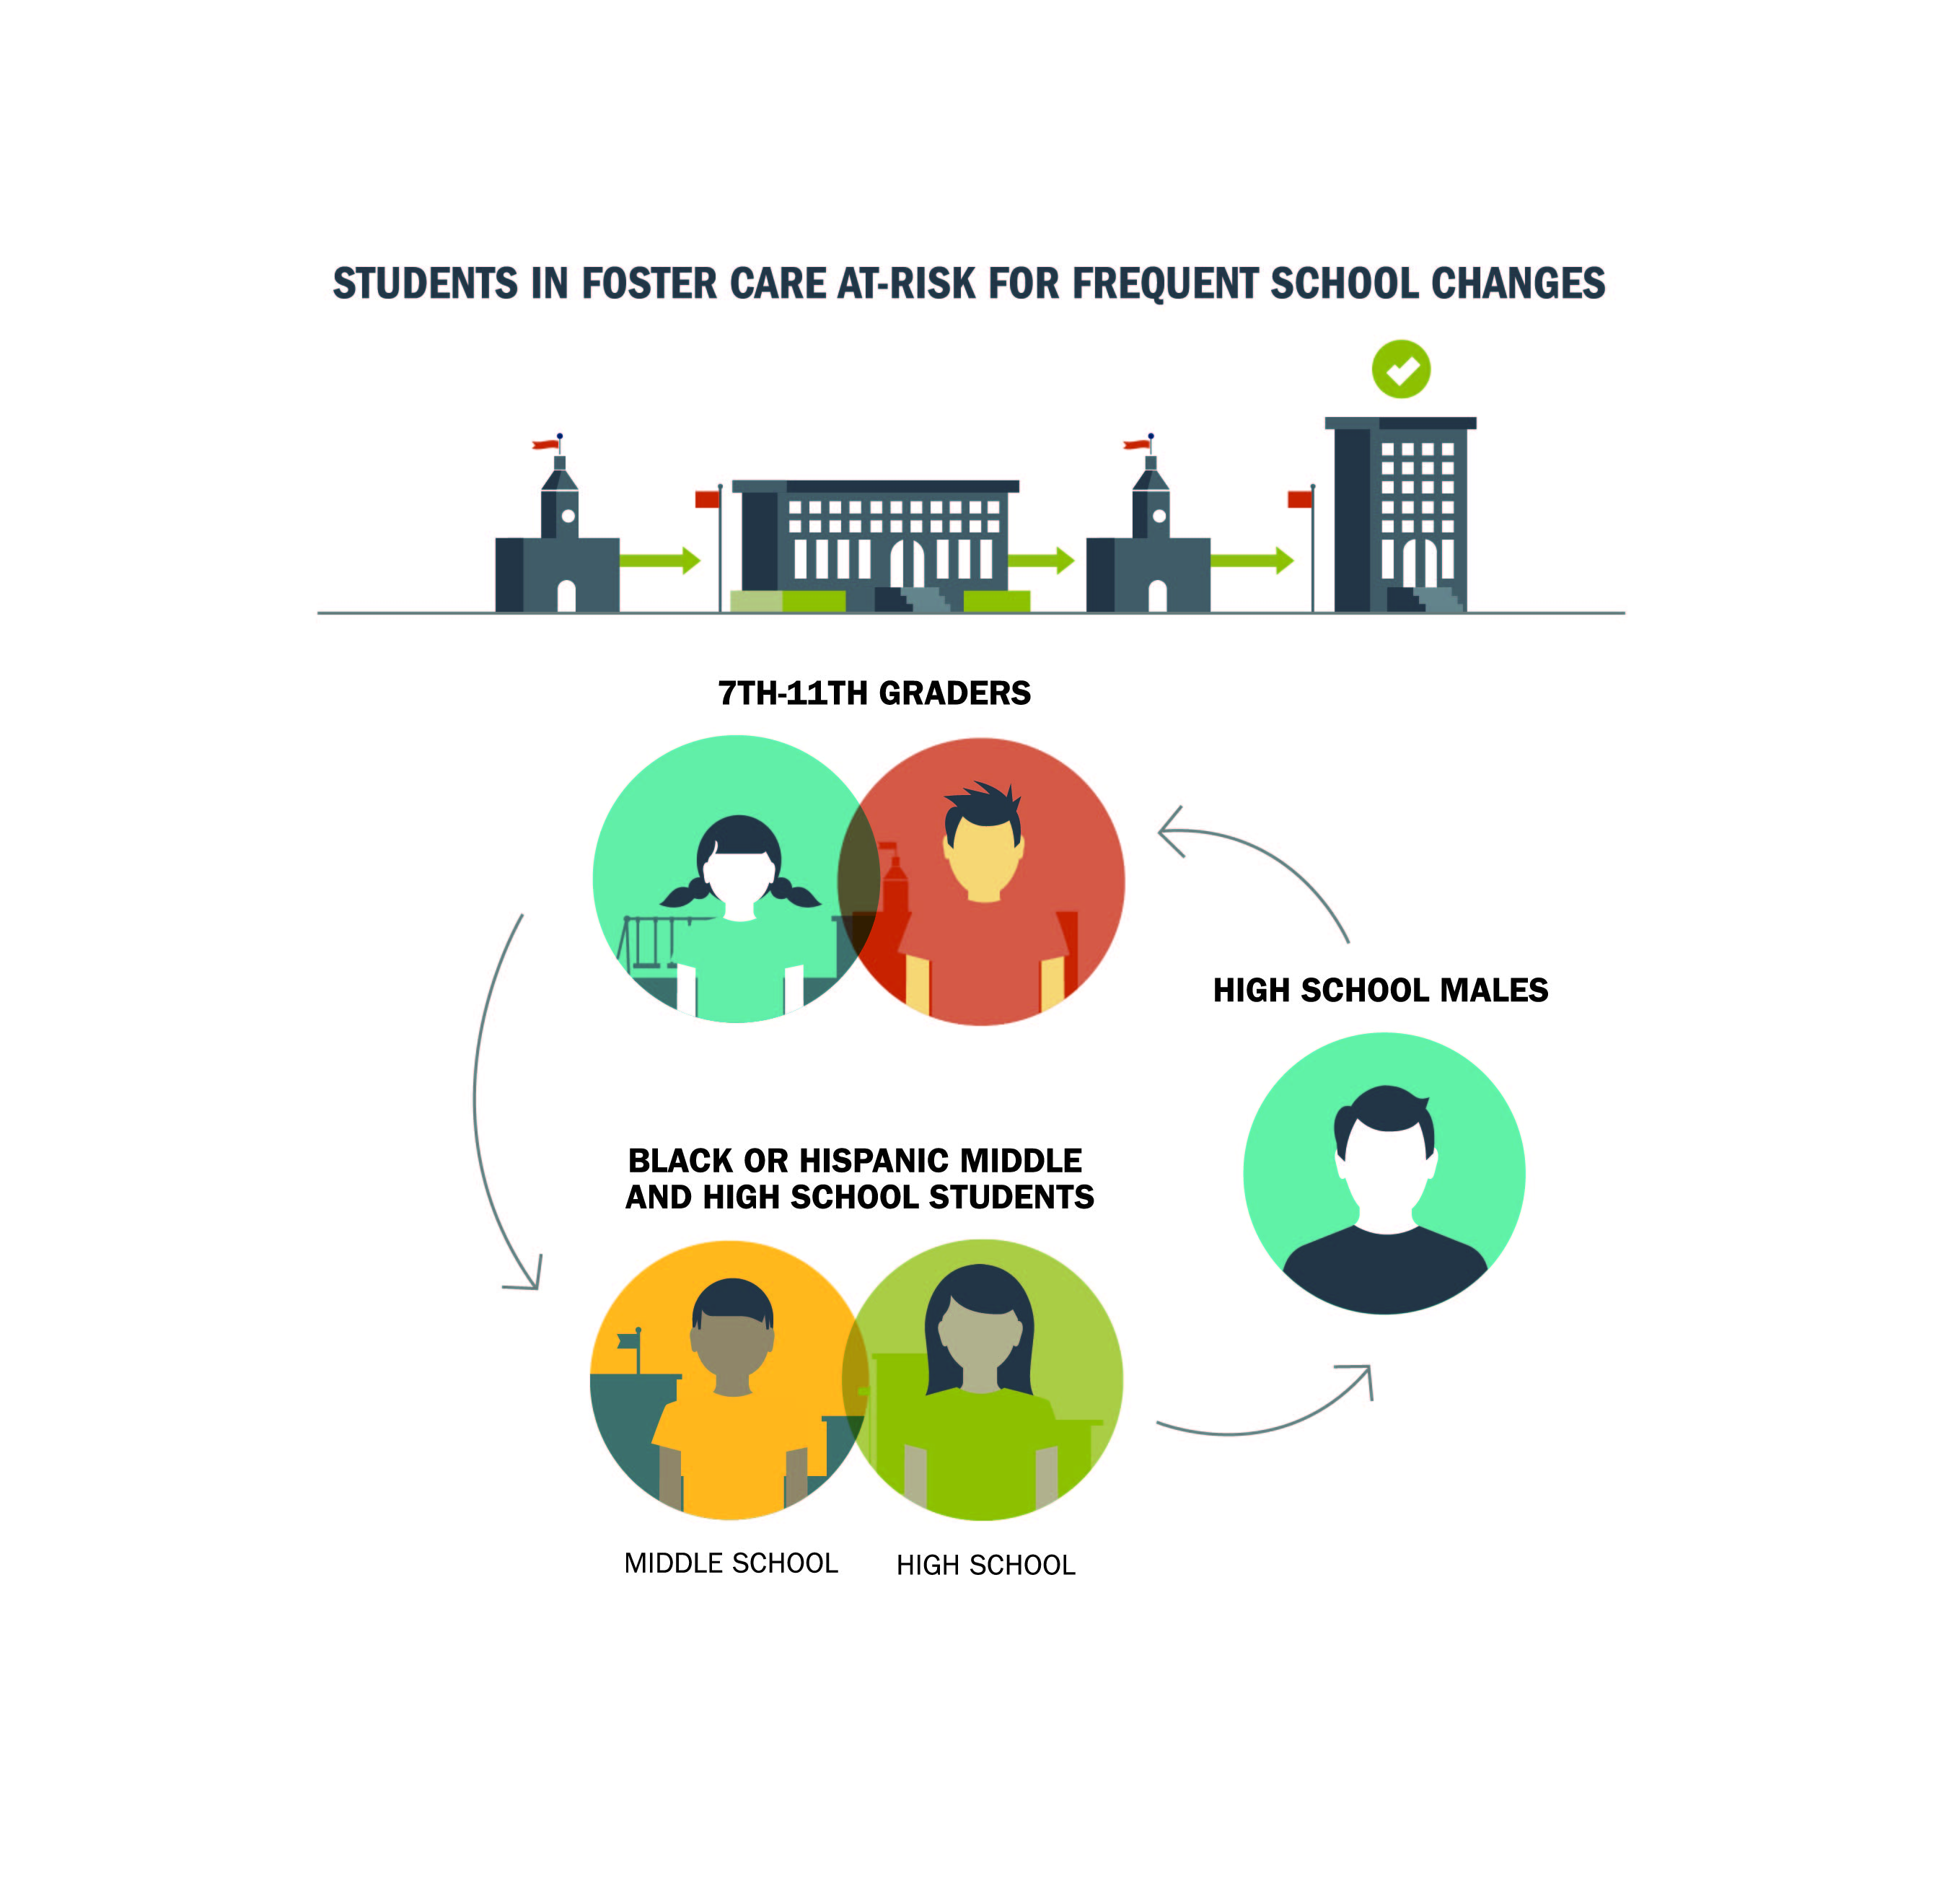
Description: Of the students in foster care who do change schools, 7th- 11th graders, black or hispanic middle and high school students, and high school males are at-risk for frequent school changes.
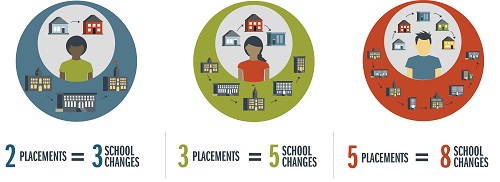
Report: Closing the Educational Stability Policy Gap (2017)
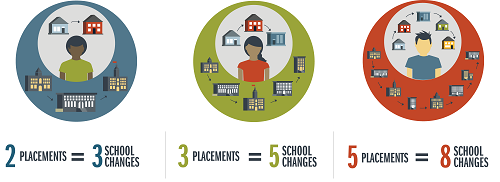
Description: Students in foster care changes schools even more often than they change placements. For the typical student in foster care, two placements will have three corresponding school changes. Three placements results in five school changes, and five placements results in eight school changes.
 Download as
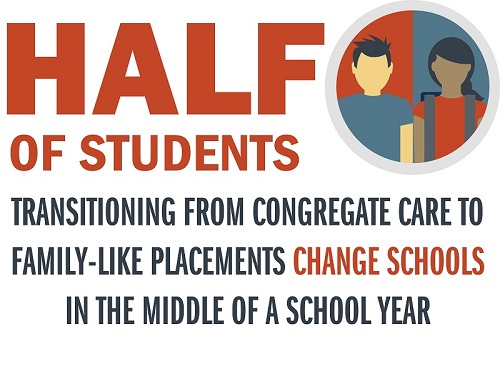
 Report: Closing the Educational Stability Policy Gap (2017)
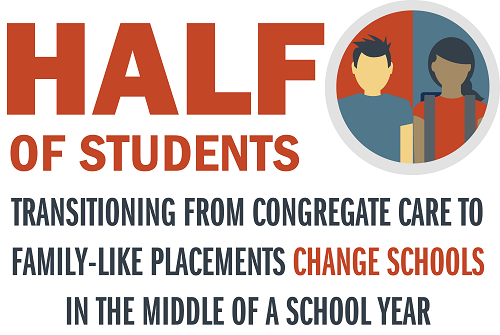
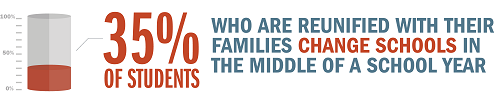
Description: Half of students transitioning from congregate care to family-like placements change schools in the middle of the school year.
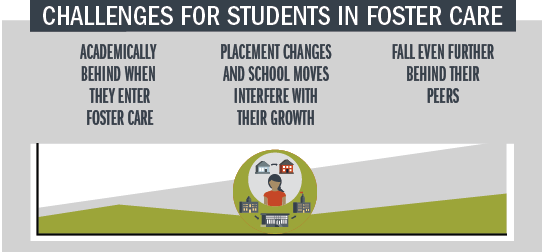
Report: Closing the Achievement Gap for Students in Foster Care (2018)
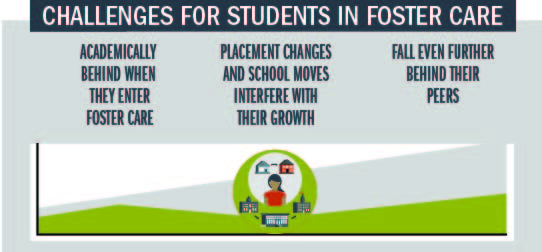
Description: Foster students face a litany of challenges: they are academically behind their peers when they enter care, placement changes and school moves interfere with academic growth, and they fall even further behind.
Report: Closing the Achievement Gap for Students in Foster Care (2018)
Description: Students who experience foster care are among the most vulnerable student populations in the U.S.

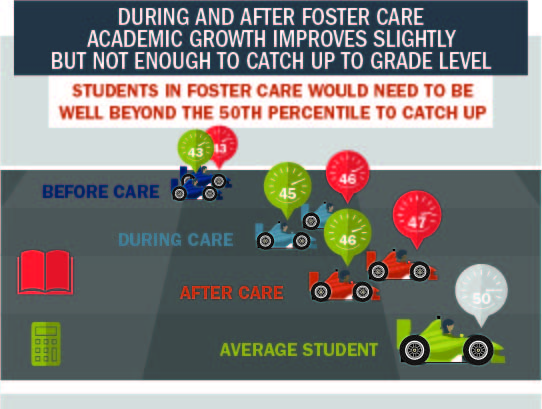
Report: Closing the Achievement Gap for Students in Foster Care (2018)
Description: During and after foster care, academic growth improves slightly, but not enough to catch up to grade level. To catch up to their peers, students in foster care would need to be well beyond the 50th percentile, but instead remain below the 50th percentile in both reading and math, effectively continuing to fall even further behind.
Report: Closing the Achievement Gap for Students in Foster Care (2018)
Description: Recommendations: 1) Intervene early; 2) Plan for stability; and 3) Offer long-term support.

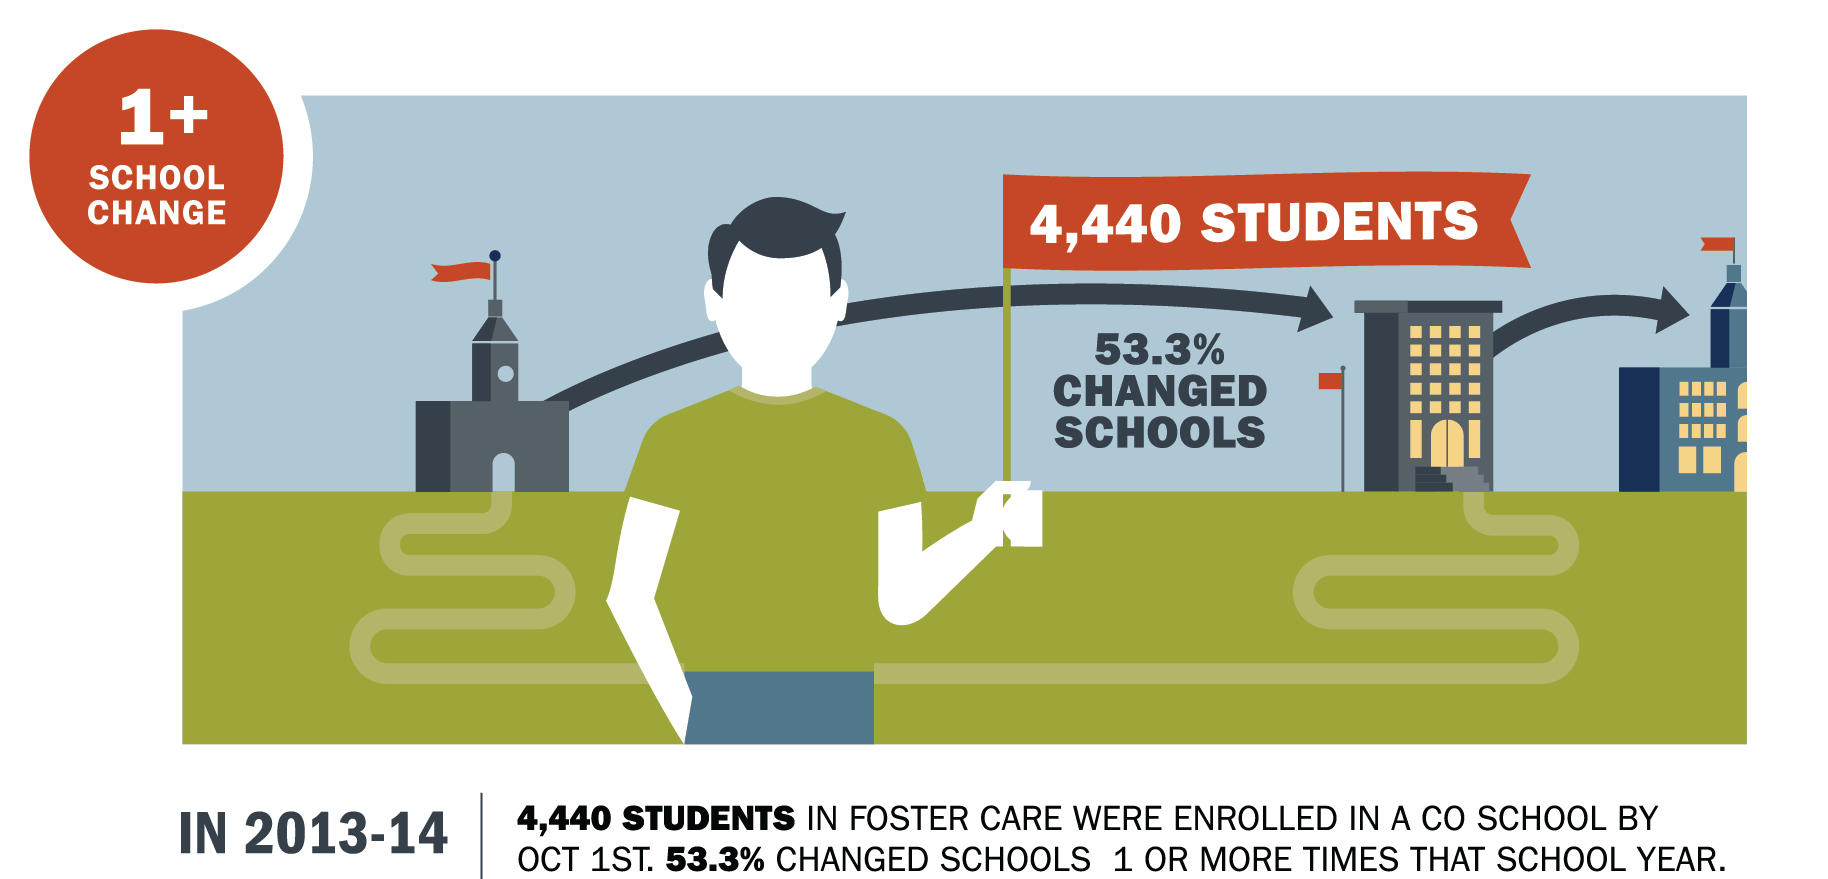
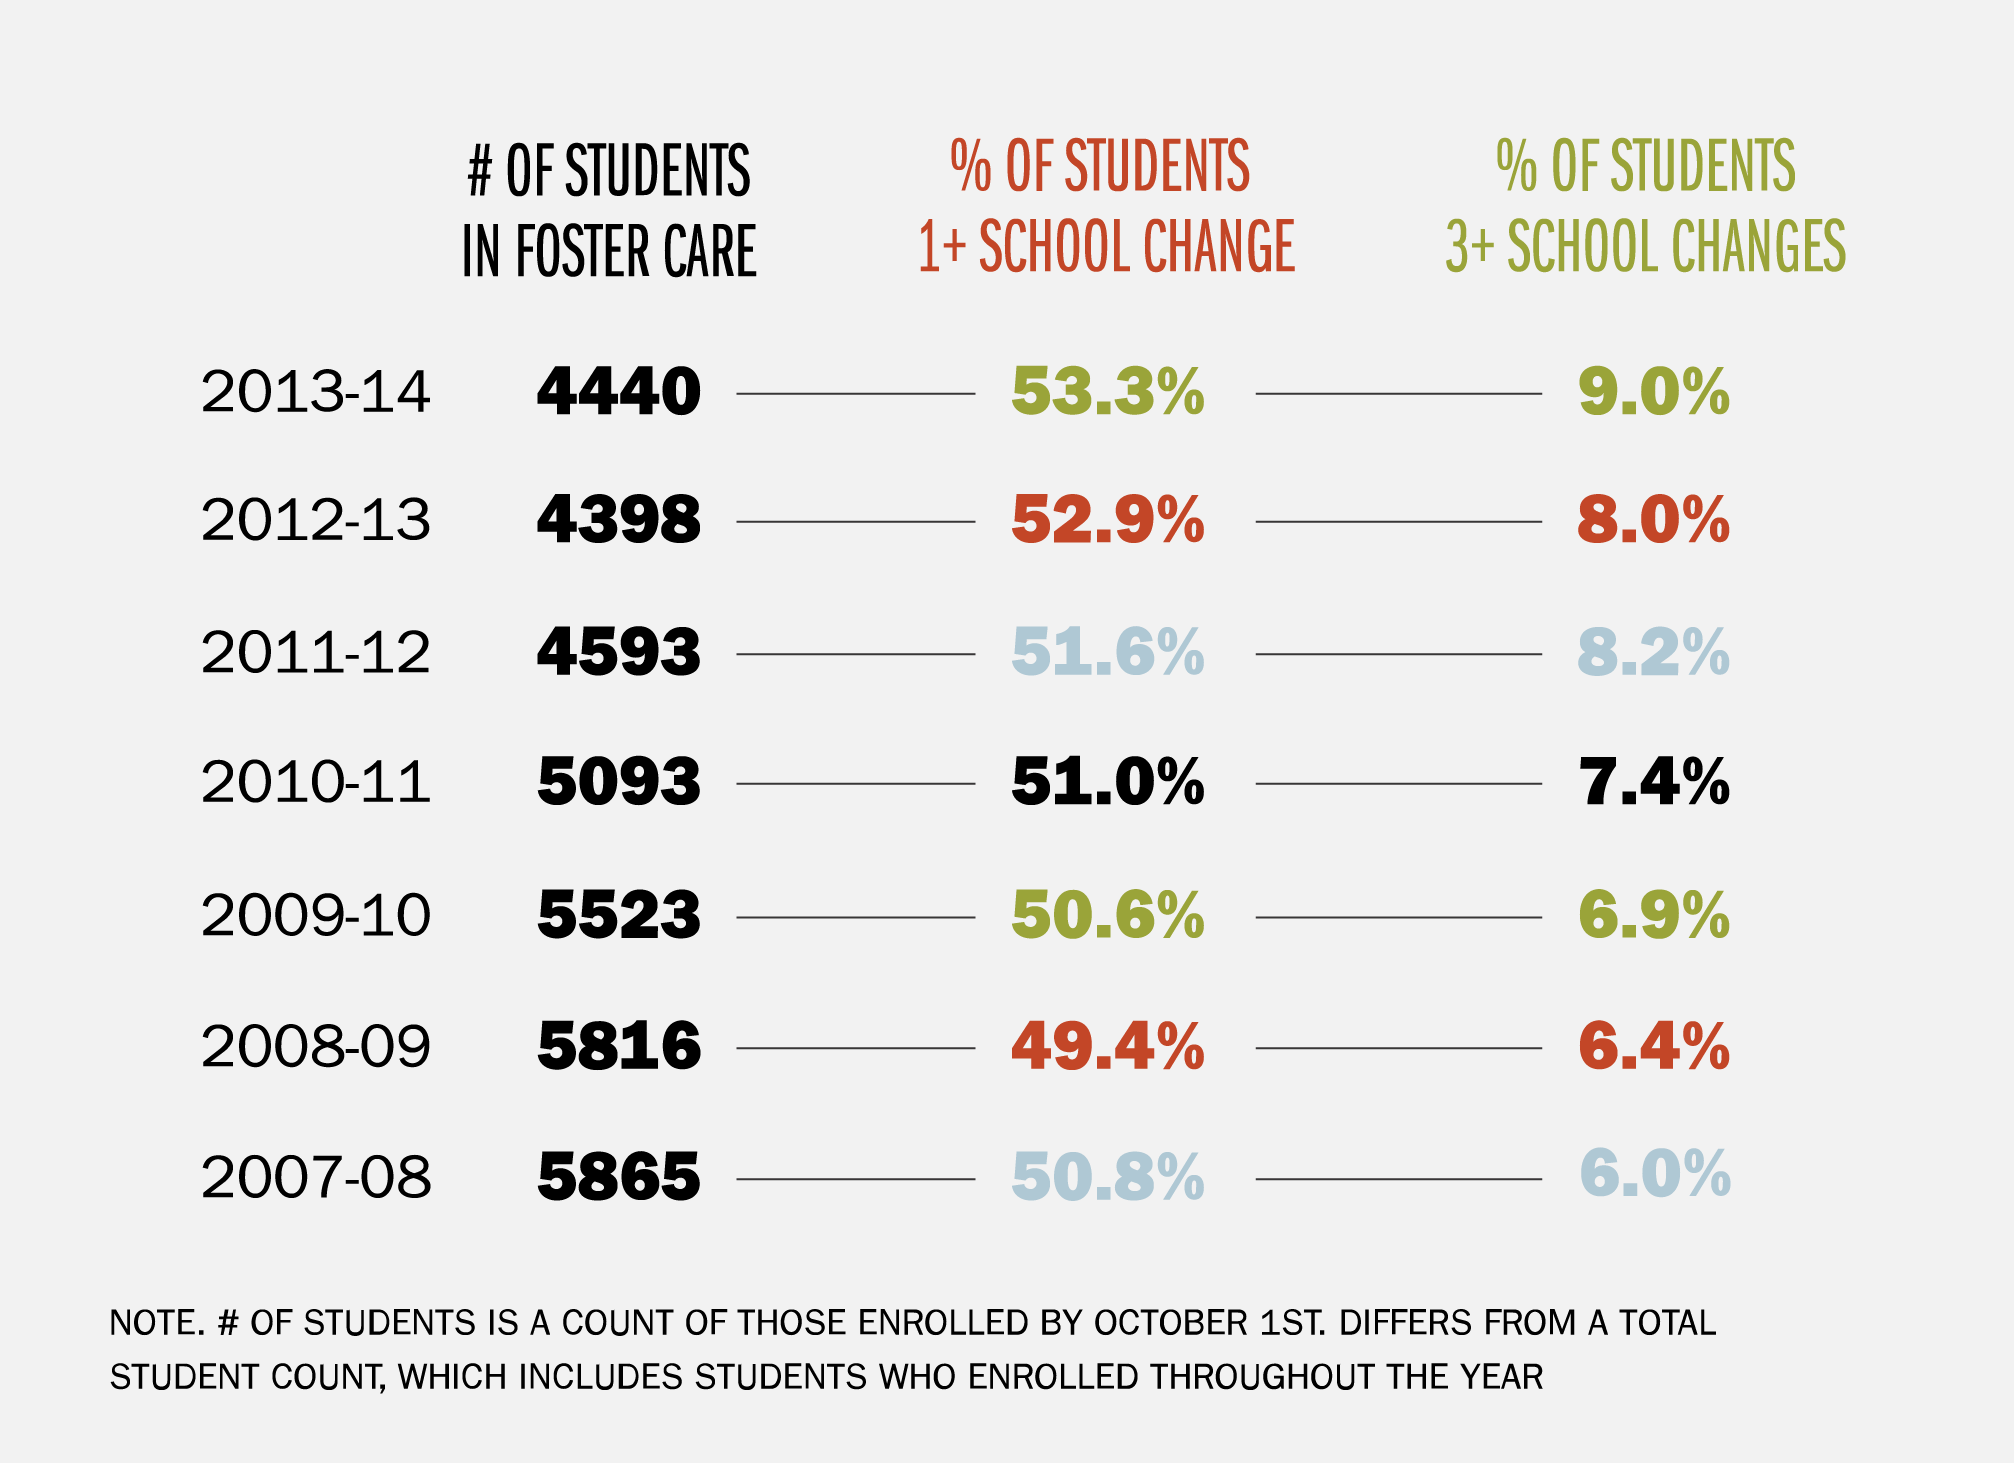
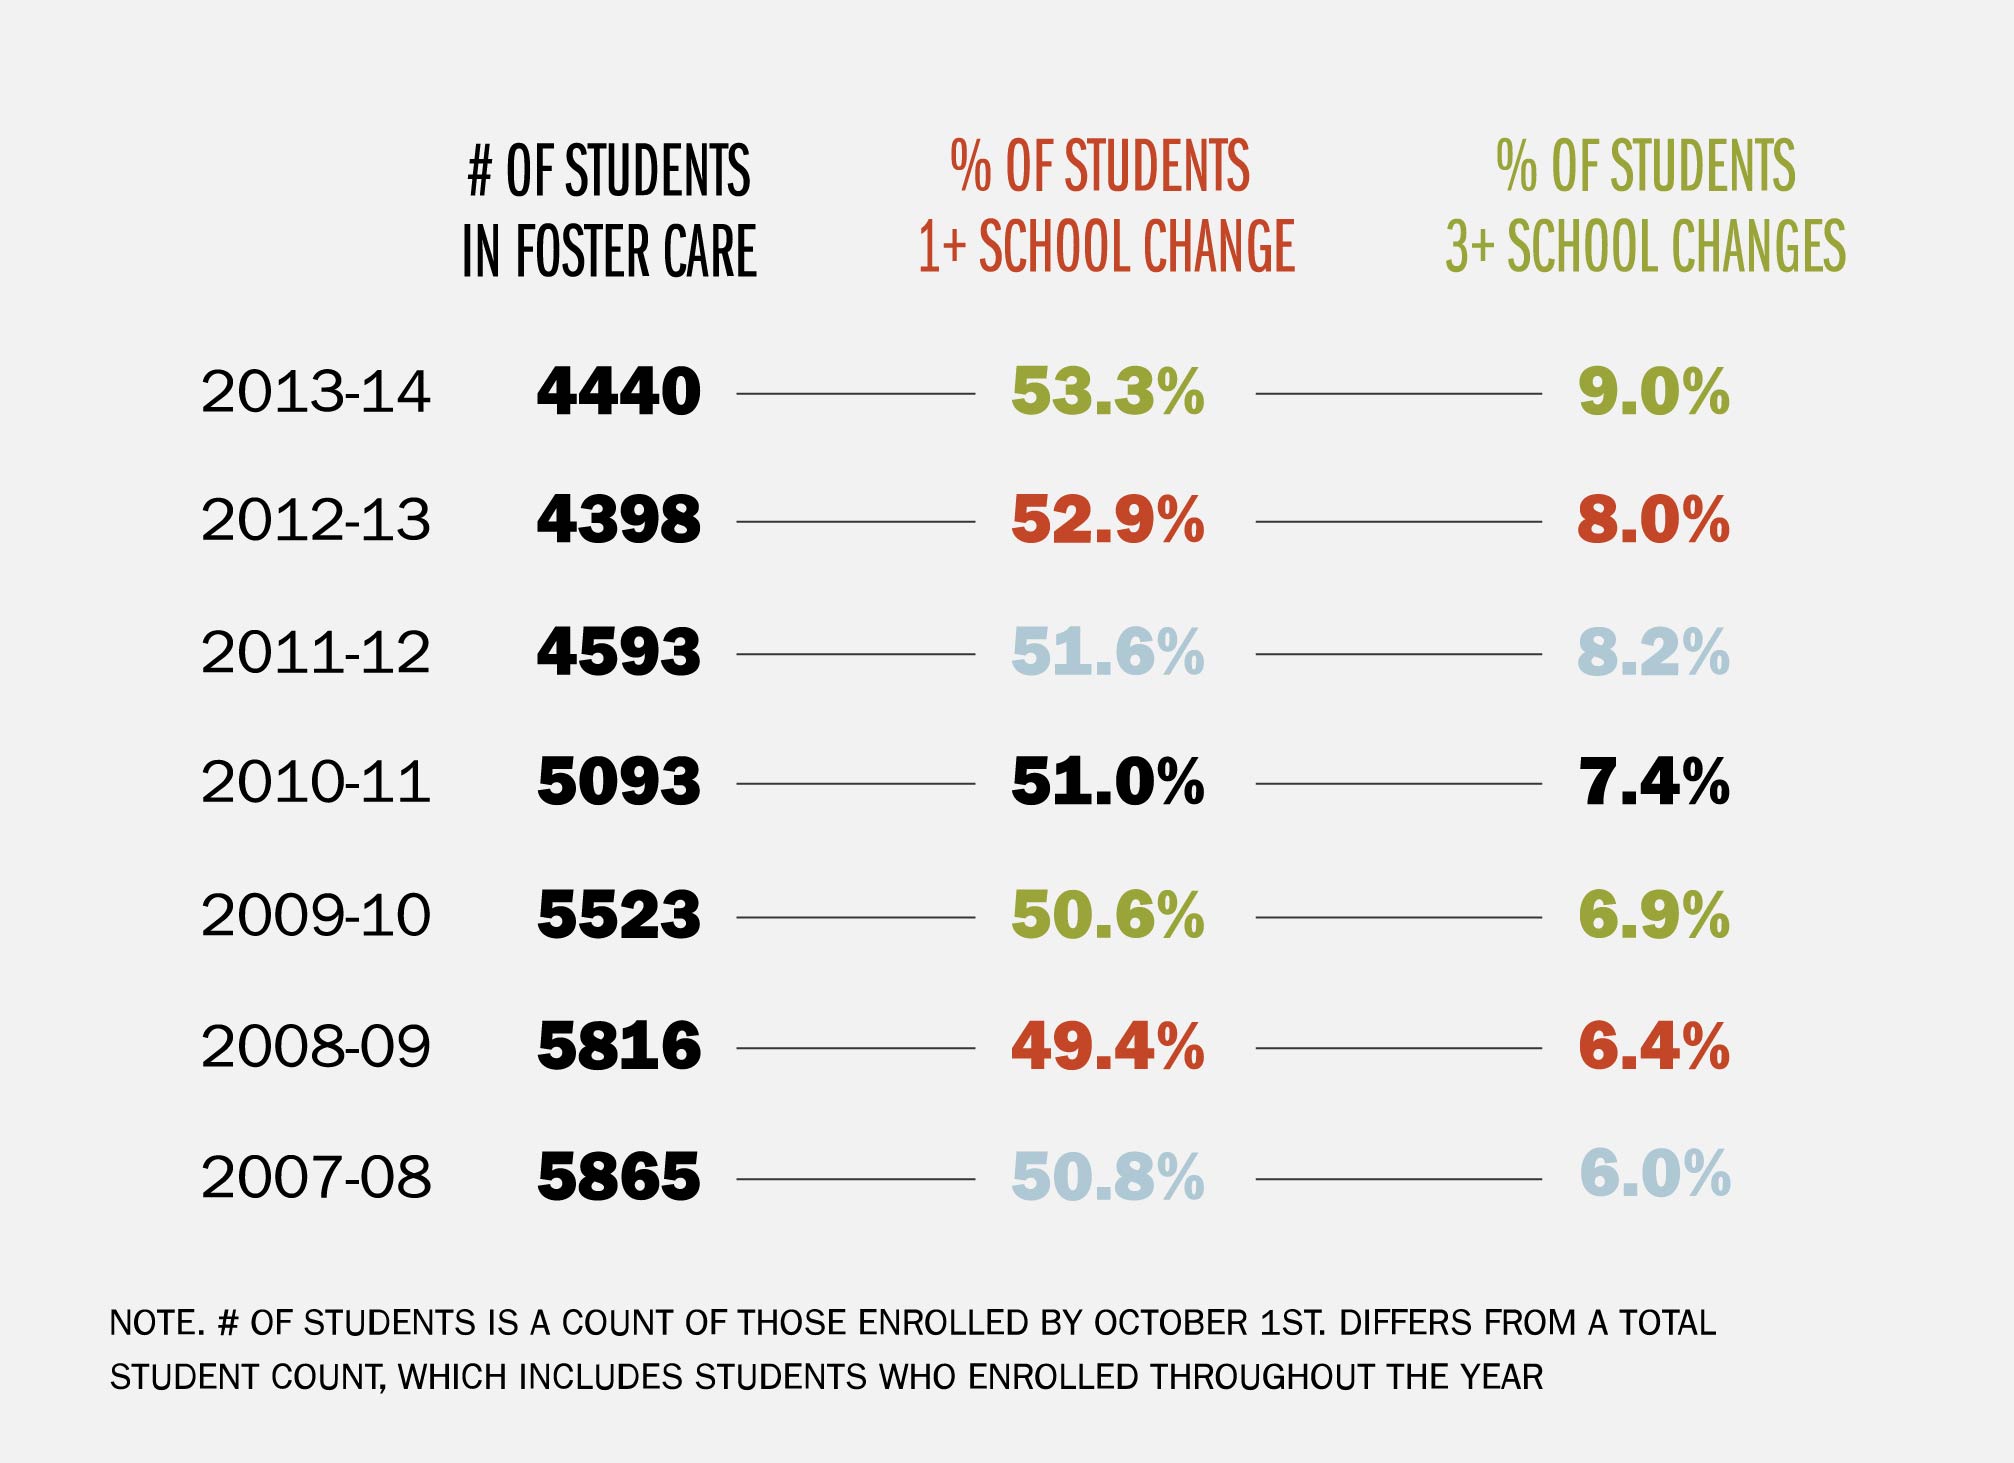
Report: Every Transition Counts (2016)
Description: The Number of Students in Foster Care Declined, The Percentage of Students in Foster Care Who Changed Schools Increased

Download Infographic Bundles
Here, you can download all infographics in different formats.
All Files
This zip file includes all infographics in .SVG, .PNG, and .JPG formats.
Download All FIles »
.SVG
Use these files in print materials. They can scale to any size.
Download SVG Files »
.PNG
PNG files have a transparent background ideal for web and other on-screen use.
Download PNG Files »
.JPG
White background JPG files are best for web or on-screen use, not print.
Download JPG Files »
